
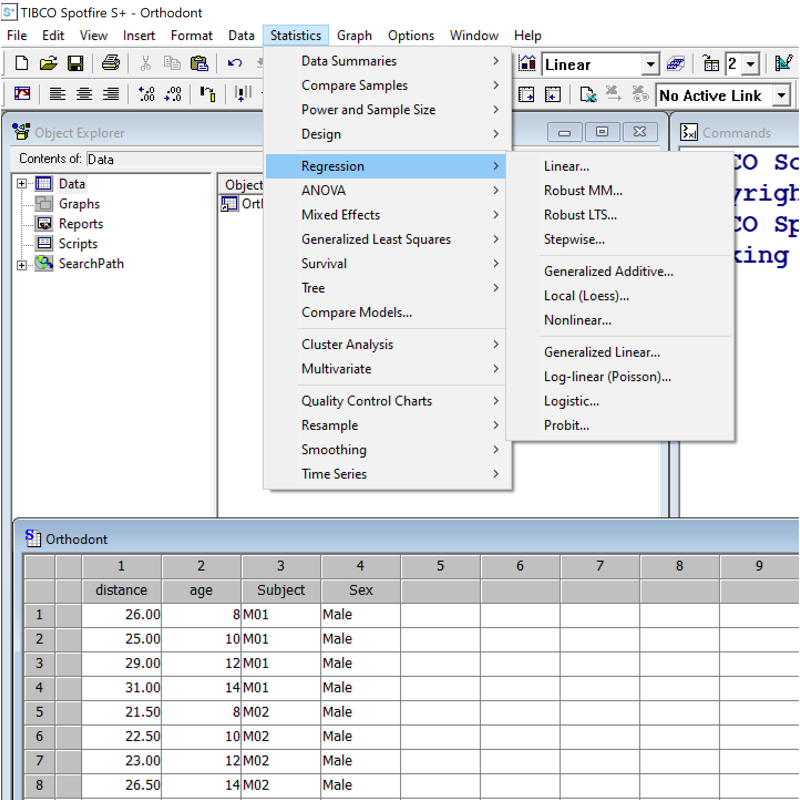
Description
- Introduction to the S+ point & click Interface
- Accessing Help
- Creating Working Directories for different projects.
- Data Import/Export & Editing
- Data Manipulation including Stack, Subset & Merge
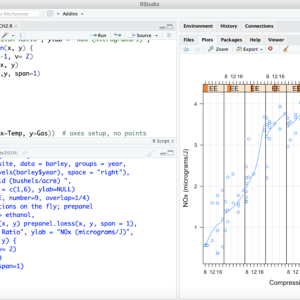
- How to Create & Edit Graphics – Histograms, Box Plots, Bar Charts, Scatter Plots & 3D Plots
– Changing symbols, colours, style of points, axes, range etc
– Labelling & Identifying Points. Adding Titles etc
– Multiple Graphs on a single graphsheet. - Exporting Graphics
- Linear and Non-Linear Regression via the drop-down menu