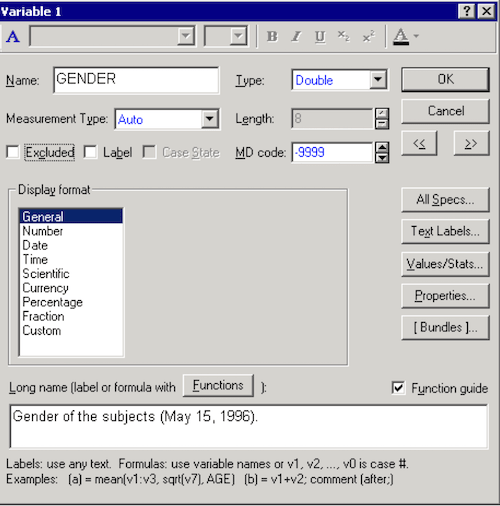
The variable (column) headers in the spreadsheet contain the variable names. Double-click on the first variable header – GENDER – to display its Variable specifications dialog and display format options.
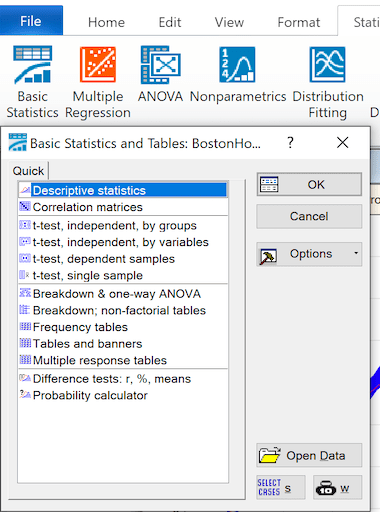
Basic Statistics Start Panel
Point & click access to descriptive statistics, correlation, t-tests etc
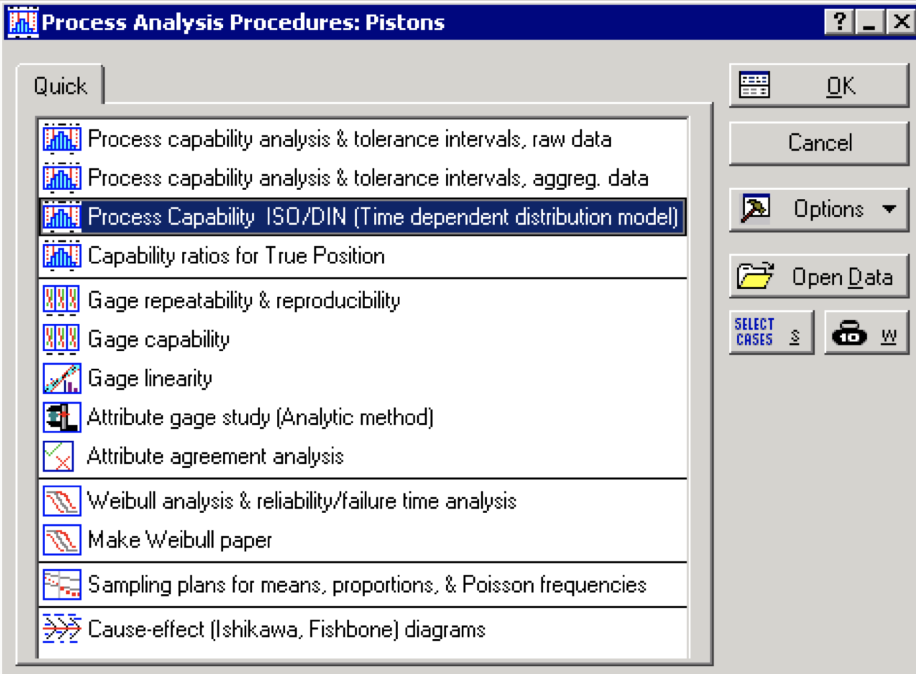
Process Capability Analysis
Consistent with DIN 55319 and ISO 21747
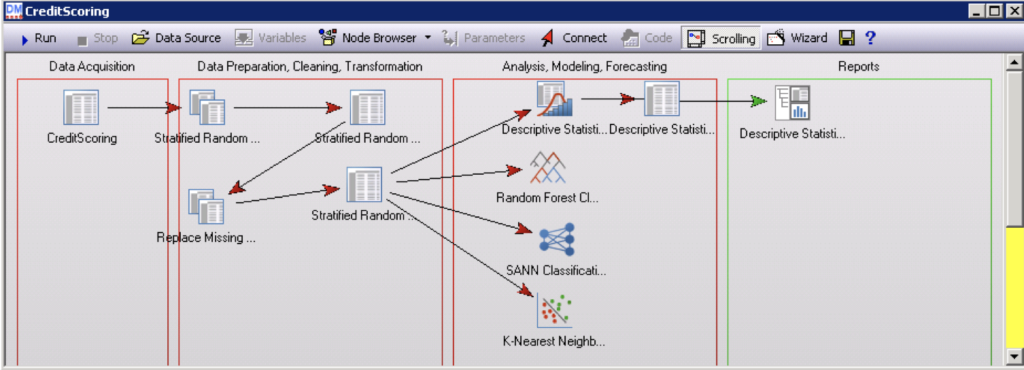
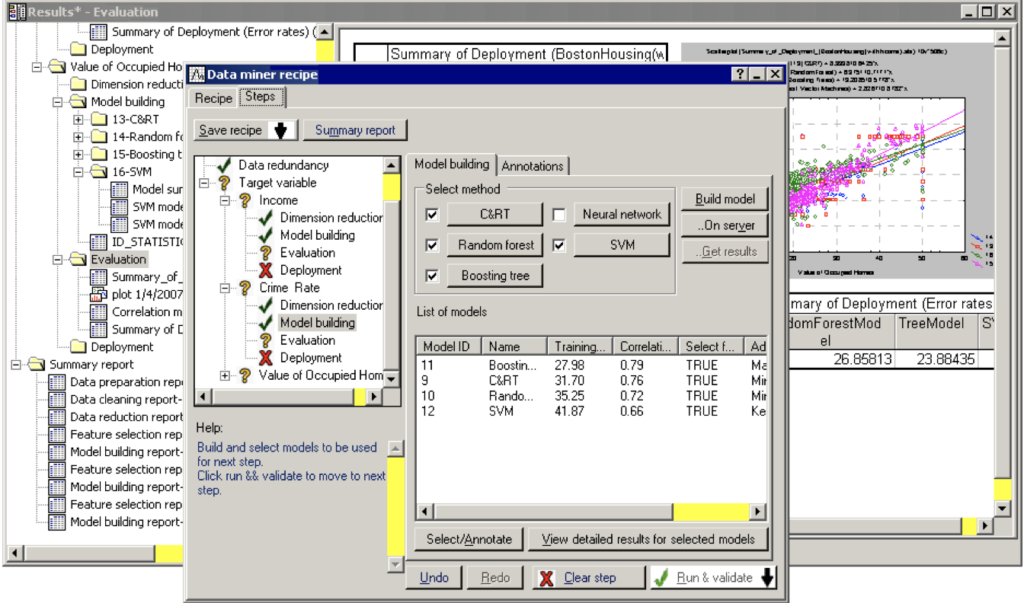
Statistica Data Miner (SDM) is a comprehensive system for predictive modeling that offers a wide variety of analytic techniques and model building, validation, and model deployment options.
Data Miner Recipes enable those without extensive experience with data mining tools to move very quickly from the definition of a problem to tangible and actionable results.
In this approach, you simply follow a recipe-like user interface to complete the necessary steps to move to a solution. In fact, most of these steps are entirely automated so that the only required input is to define the data and variables for the analyses, while the program automatically does the rest – determines learning and testing samples, performs feature selection, tries various data mining algorithms and methods, and evaluates results to select the best data mining model.
Feature List
Convenient window-based GUI with easy-to-use menus and dialogs
File import and export dialogs
Database import and export dialogs¹
Dialogs for data preparation, charting and statistical modeling
Interactive command-line with history recall
Manage objects with Object Explorer¹
Script file editor¹
Multiple data and graphics windows
Cut-and-paste to Word, PowerPoint and Excel¹
Integrated Excel spreadsheets¹
PowerPoint Wizard: quickly create slides from charts¹
Create custom toolbars, menus and dialogs¹
On-line help and manuals
Integrate with many data and graphics formats
ASCII: fixed format, comma-separated, and tab-delimited
Spreadsheets: Excel, Lotus 1-2-3, Quattro Pro
Application data: SAS 7/8/9, SPSS, Matlab, Minitab, Sigma Plot, Systat, STATA, Gauss, Epi Info and more
Database files: Paradox, dBase, Access, FoxPro
Financial data sources: LIM, Bloomberg, FAME
Native database clients: SQL Server¹, Oracle, Sybase, IBM DB2
ODBC interface to compliant databases
Read and write Spotfire binary and text files directly, helping to preserve important metadata when moving between applications.
Export graphics as PDF, PostScript, GIF, PNG, JPG, WMF, bitmap, TIFF and more
Customised, automated reports: XML reporting library speeds development of customized reports incorporating statistical tables and publication-quality graphics.
Create custom graphics
Interactive graphics system with a large & normalized palette for the creation of statistical charts to your exact specifications.
Scatterplots, histograms, pie charts, box plots, bar charts, dot charts, time series charts, 3-D wireframe charts, image plots and many more.
Brush and spin dynamic visualization
Programmatic control over colors, lines, axes, annotations and layout
Unique Trellis™ graphics – create multiple charts conditioned by levels of one or more variables
Create interactive, embedded web-based charts with S‑PLUS Graphlets™
Element-Specific Graph arguments for plots and command-line graphics
Cox proportional hazards models with mixed effects
Left, right, and interval censoring
Time-dependent covariates and strata
Multiple event models
Competing risk models
Frailty models
Parametric survival
Expected survival
Person years analysis
Aalen’s Additive Regression Model
Time Series Analysis
Autocovariance, autocorrelation and partial autocorrelation
Smoothed periodograms
Box-Jenkins ARIMA models
Classical and robust AR
Long-memory models
Seasonal decompositions
Fourier transformations
Classical and robust smoothers and filters
Robust Statistics
Robust estimation and inferences
Robust MM regression
Robust GLM, ANOVA, covariance, principal components, and discriminant analysis
Least trimmed squares regression
Minimum absolute residual regression
Visually compare robust and traditional methods
Missing Data
Multiple imputation
Gaussian, logistic, and conditional Gaussian models
Date, Time, and Calendar Data
Univariate and multivariate time series
Aggregation, alignment, merging, and interpolation
Times and dates from milliseconds to millennia
Time zones with international daylight savings rules
Holidays and financial market closures
Custom time and date formats
Relative time, time sequence, and event objects
Powerful time-series charting
System Requirements
Processor
2GHz or faster, Quad core (1 GHz, Dual core, minimum)
Hard Disk
500 MB of disk space to install (If you are not installing on Drive C:\, an additional 50MB free disk space on Drive C:\ is required for the installation) Administrator rights are required to install
Operating System
Microsoft® Windows 10 Microsoft® Windows 7 (32-bit and 64-bit) Microsoft® Windows Vista® SP2 (32-bit & 64-bit) Microsoft® Windows XP® SP3 (32-bit) Parallels Desktop 15 for MacOS X 10.10 – 10.15