
R for Data Science courses
Learn how to use R for data understanding, data prep., modelling, evaluation and production.
ML models for regression and classification covered. R scripts included.
All courses are instructor led, in person in our Sydney CBD office or live-online
Getting Started in R
Tue, 21 Jun 2022, 9am – 4pm
A$880/attendee + gst
Learn how to import, visualise and analyse data in R, avoid common pitfalls and work with R objects/packages
Who will Benefit: Business analysts, Data scientists that are new-ish R users. No experience in R, is necessary. Course has largely been developed with input from customers, through experience in providing support, training and consulting.
- Introduction to R
- Accessing Help
- Creating Working Directories for different projects.
- R Language Objects & Classes
- Data Import/Export
- Data Manipulation including Stack, Subset & Merge
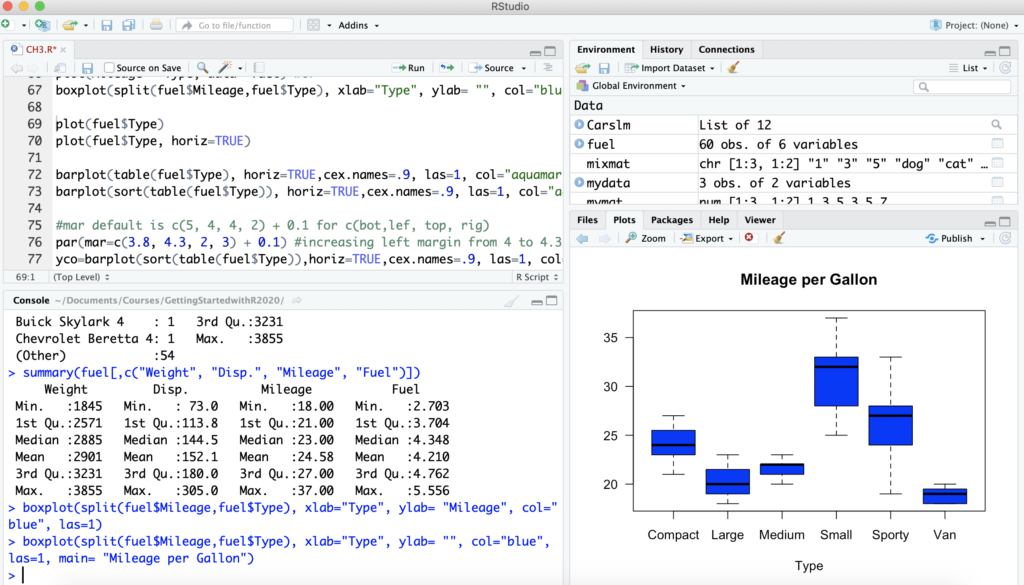
- Data Analysis & Graphics
– Histograms, Box Plots, Bar Charts, Scatter Plots
– Changing symbols, colours, style of points, axes, range etc
– Labelling & Identifying Points. Adding Titles etc
– Multiple Graphs on a single graphsheet.
– Plotting Subsets of Rows
– Adding points, lines, legends to existing plots - Exporting Graphics
- Statistical Models in R
– Linear Regression
– Non-linear Regression
Intermediate R
Wed, 22 Jun 2022, 9am – 4pm
A$1,380/attendee + gst
Learn best practices, efficient code for data preparation, create advanced visualisations, more advanced regression models and tree based methods.
Build validated machine learning models for a numeric target variable.
Course outline:
- Introduction & Preliminaries
- Efficient use of R Language objects & functions
- Programming in R – writing functions
- Advanced Visualisations, including Trellis and ggplot2
- Data Science/Predictive Modelling:
– Multiple regression
– Stepwise regression
– Regression tree based methods
– Accuracy measures
– Validation
- Unsupervised Learning methods
– Heirarchical
– Kmeans
Advanced R
Thu, 23 Jun 2022, 9am – 4pm
A$1,380/attendee + gst
Analyse and visualise large datasets using the latest out-of-memory, big data packages.
Build validated ML classification models, eg for Churn, cross/up-sell, staff retention etc
Course outline:
- Working with Big Data in R
– Big data graphics, models and manipulation - Classification modelling:
– Logistic regression
– Discriminant Analysis
– Trees: Bagging, Random Forest & Boosting
– SVM
– Accuracy measures
– Split/Cross Validation - Automation in R, including batch processing and deploying to production
- Reporting: R Shiny and R Markdown