RapidMiner Go

Automated and guided machine learning web interface.
Point/click data science for domain experts, business users and analysts – AutoML for everyone.

RapidMiner Go - AutoML comparison table

Access from your browser. Deliver a machine learning model & full business case in minutes.
Computationally heavy model creation is offloaded to a server, on-prem or in the cloud.

Rapidminer Go - Start screen

Ready

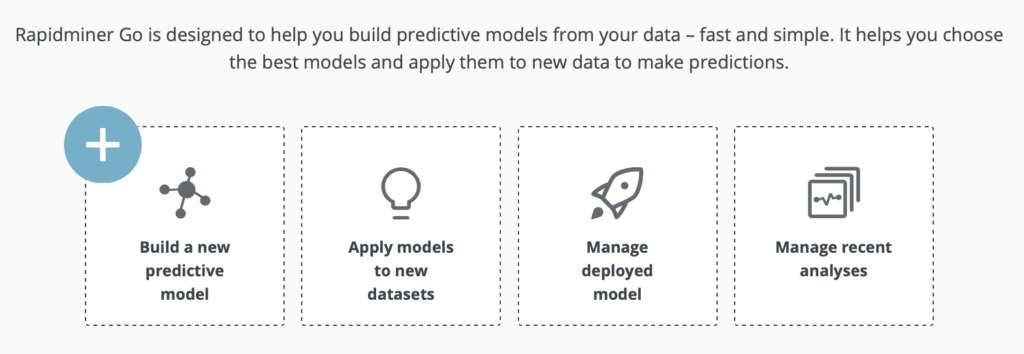
Begin by building a new predictive model, apply an existing model to new datasets or manage deployed models and recent analyses

RapidMiner Go - Build a predictive model

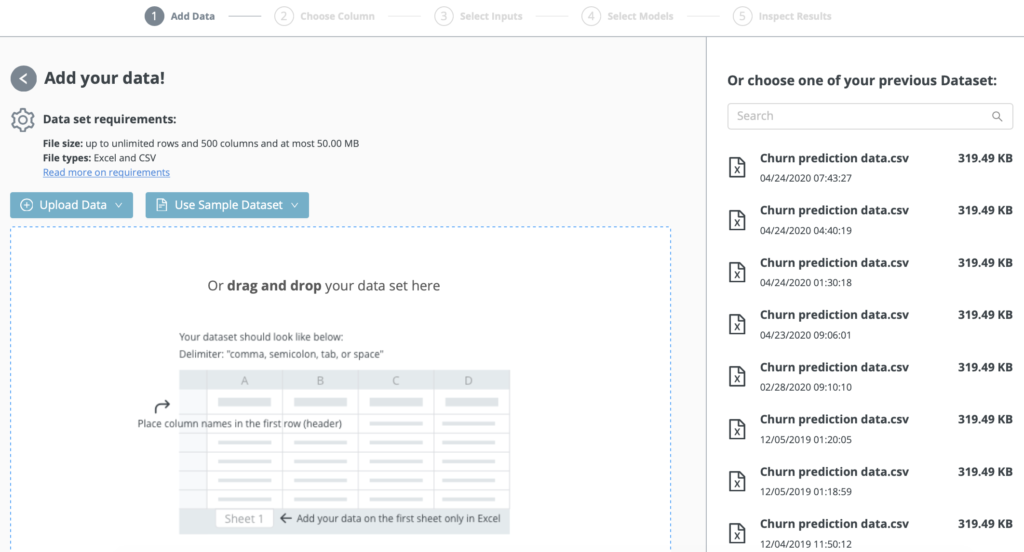
Building a new predictive model…

Upload or drag and drop your dataset

Test drive Go?
Please enter your email.
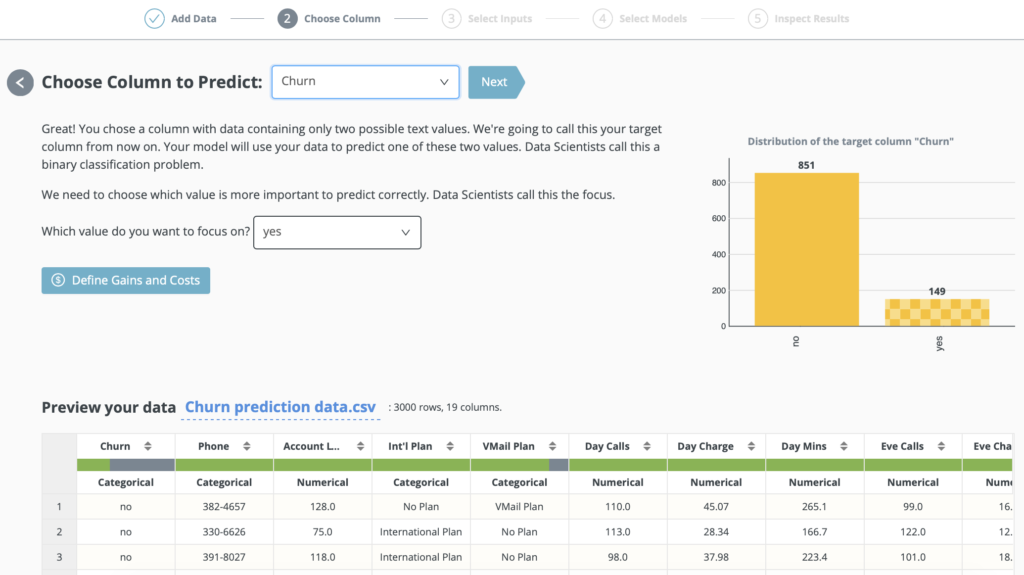
RapidMiner Go - Select feature to predict.

Choose the Column to Predict

You can also optimize your model for profits & ROI, by defining gains/costs for correct/wrong predictions
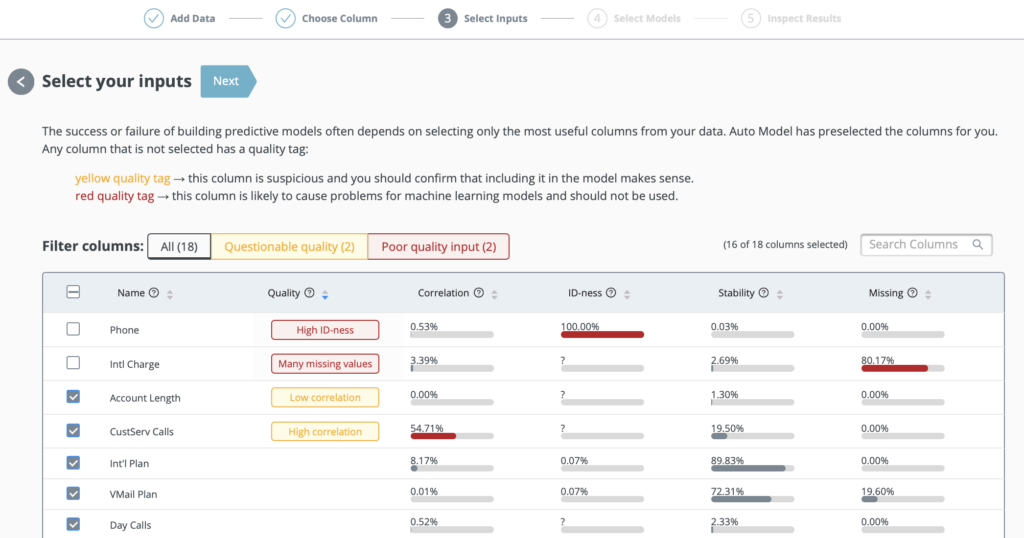
Input for predictive models

Select the input columnsSet

Successful predictive models are defined by including only the most useful input variables

Auto model feature helps here, by preselecting columns, and providing red or yellow quality tags
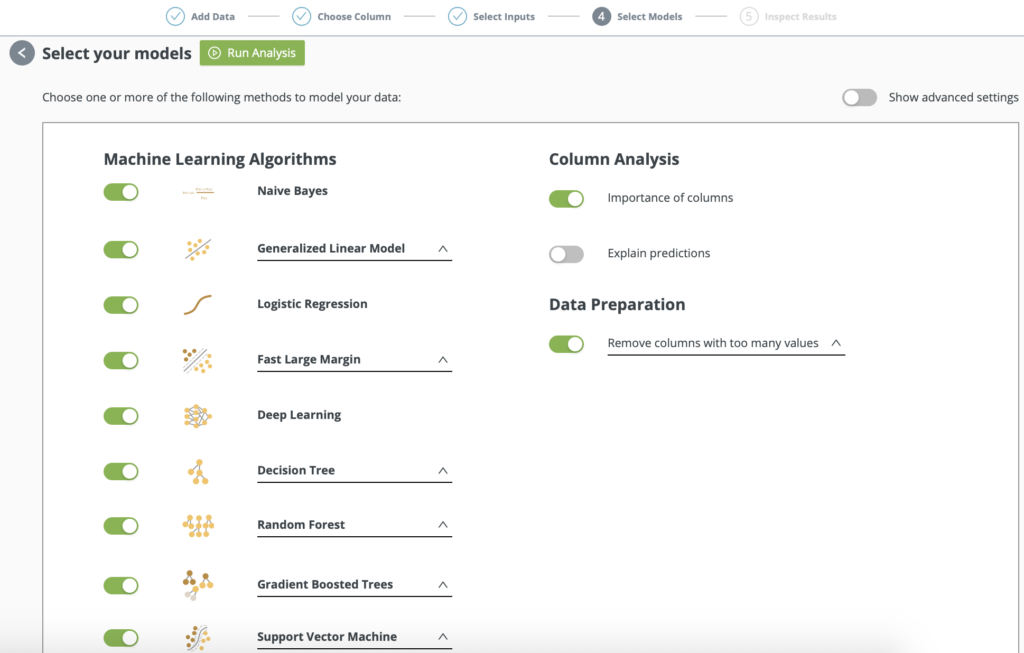
AutoML - select machine learning models

Select your models and Go

AutoML results

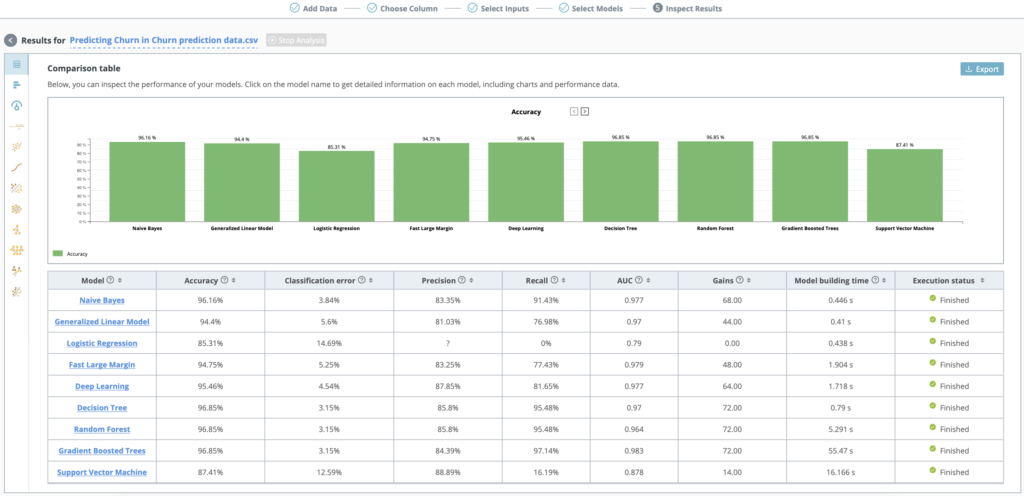
Inspect the performance of your models with the model comparison dashboard

Compare accuracy, classification error, precision, recall, AUC, accumulated benefit from cost sensitive learning and model building time.

AutoML - input column importance

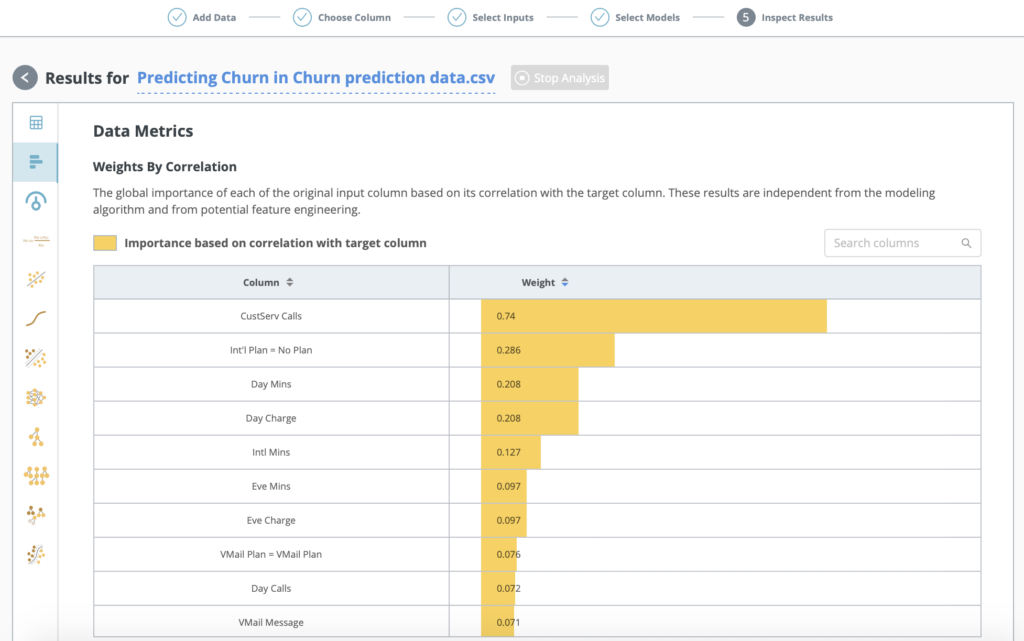
Explore the importance of each input column based on its correlation with the target column.

AutoML model simulator

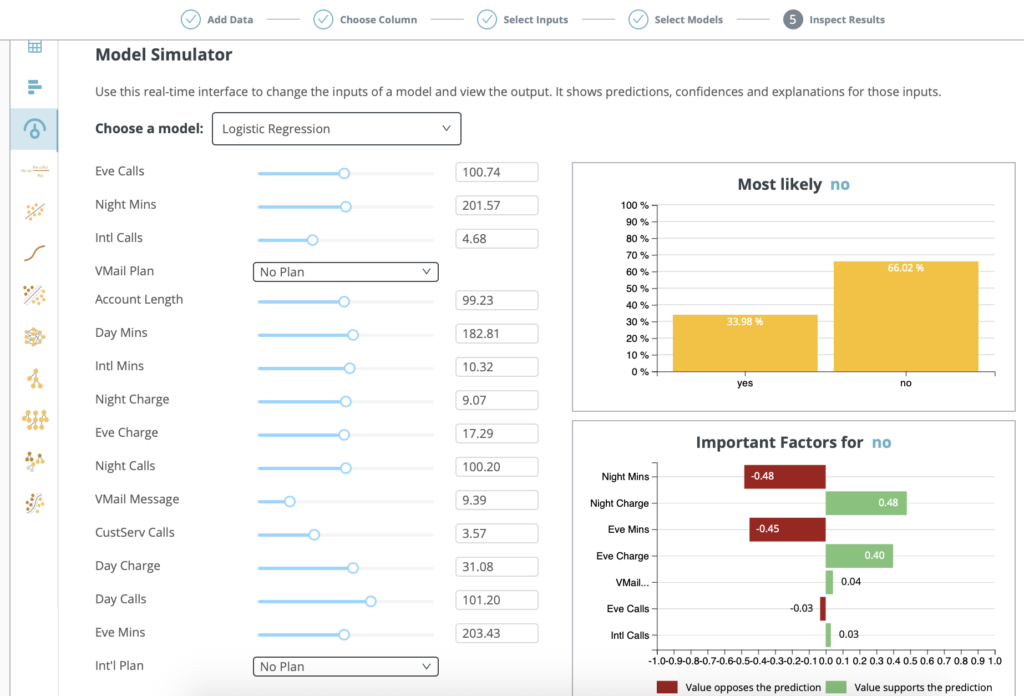
Model Simulator helps you understand how your model will behave under different sets of conditions.

Select a model and use the real-time interface to change the inputs of a model and view the output.

AutoML model performance

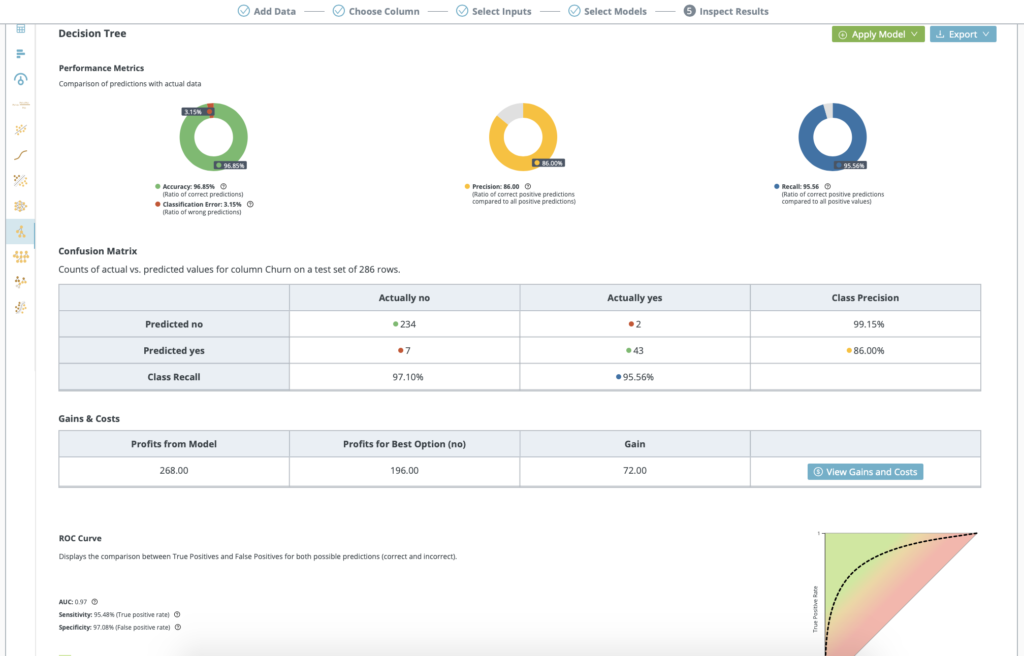
Explore the performance of each model

Calculate and assess business impact before deploying any models into production

View the performance metrics, confusion matrix, gains and costs, ROC curve and AUC.

RapidMiner Go - examine ML models

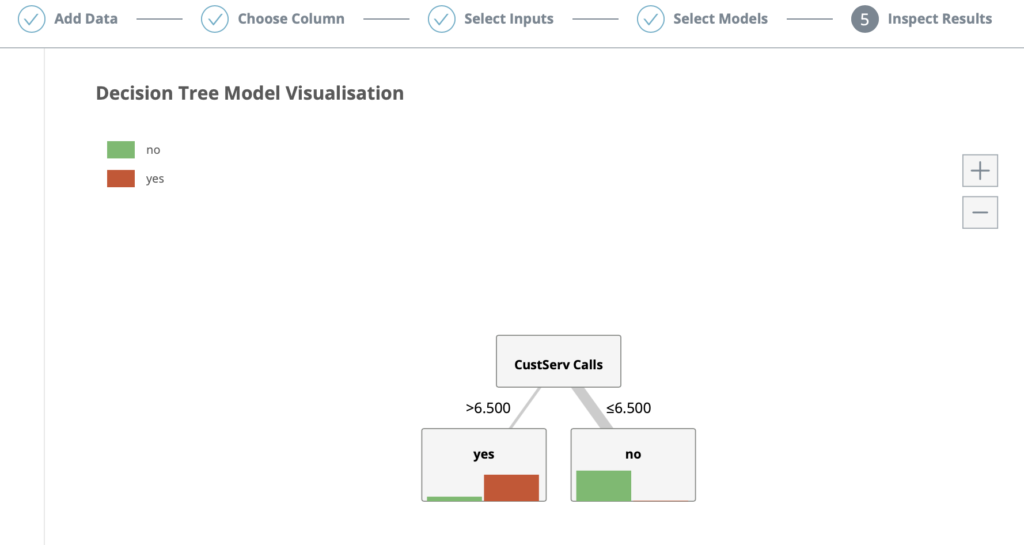
Examine model values that define predictions.

Justify your work with automatically generated supporting materials

RapidMiner Go - score models

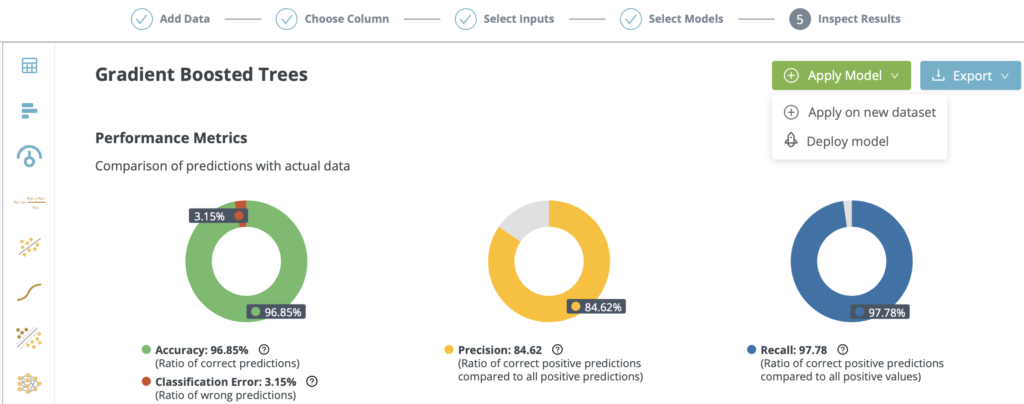
Score the model on a new dataset or deploy instantly, with or without a data science or DevOps team – AutoML for everyone.
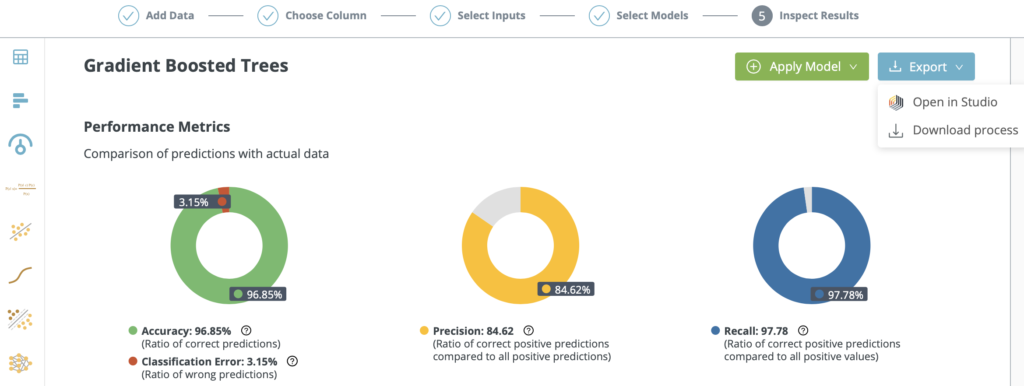
RapidMiner Go - no black boxes/

No Black Boxes

Open the process in RapidMiner Studio to fine tune or edit.

Note: To access data prep functionality or process building/edit functionality, a RapidMiner Studio license is required.

Feature List

Data Access

  • File extension: .csv .txt, .xls, .xlsx
  • Place column names in the first row (header)
  • Delimiter: comma, semicolon, tab, or space
  • Avoid special characters in column names
  • Add your data on the first sheet only (.xls, .xlsx)

Column Usefullness

  • Correlation – how closely do the values resemble the target column?
  • ID-ness – how different are the values from one another?
  • Stability – how similar are the values to one another?
  • Missing – how many missing values are in the column relative to the total?

Classification modelling (Binary and multi-class)

  • Generalized Linear Model
  • Naive Bayes
  • Logistic Regression
  • Decision Tree
  • Random Forest
  • Gradient Boosted Trees
  • Support Vector Machine
  • Deep Learning
  • Fast Large Margin

Regression (predicting numerical values)

  • Generalized Linear Model
  • Decision Tree
  • Random Forest
  • Gradient Boosted Trees
  • Support Vector Machine
  • Deep Learning

Model Validation

  • Follows a stringent modular approach which prevents information used in pre-processing steps leaking from model training into the application of the model. This unique approach is the only guarantee that no overfitting is introduced and no overestimation of prediction performances can occur
  • Performance criteria for numerical and nominal / categorical targets, including:
    • Accuracy
    • Classification error
    • Area under curve (AUC)
    • Precision
    • Recall
    • Lift
    • False positives
    • False negatives
    • True positives
    • True negatives
    • Sensitivity
    • Specificity
    • Correlation
    • Squared correlation
    • Absolute error
    • Average Relative error
    • Root mean squared error (RMSE)
  • Various techniques for the estimation of model performance including cross validation (with parallel execution of the folds)
  • Lift chart
  • ROC curves
  • Confusion matrix

Scoring

  • One – click scoring and deployment
  • Storing of models for reuse
System Requirements
On-premiseInstalled and running on your machine:

Docker >= v18.09
docker-compose >= 1.23