S+ contains the most comprehensive library of statistical & mathematical algorithms available.
For product updates and promotions,
please joinour newsletter.
Advanced econometric modeling
S+ FinMetrics is an advanced library for modeling, analyzing, and visualizing financial market data. The library includes times-series, GARCH, State-Space, multifactor modelling and much more.
Cutting Edge Numerical Optimisation
NuOPT is a sophisticated optimization package with the ability to efficiently solve linear and nonlinear optimization problems with thousands of variables and constraints.
Designed to solve a wide range of problems, from linear programming through Mixed Integer Programming (MIP) to constrained nonlinear optimization. Offering state of-art primal dual interior point methods, SIMPLEX, sequential quadratic programming and active set methods. Ensures efficient optimal solutions for both small and large problems.
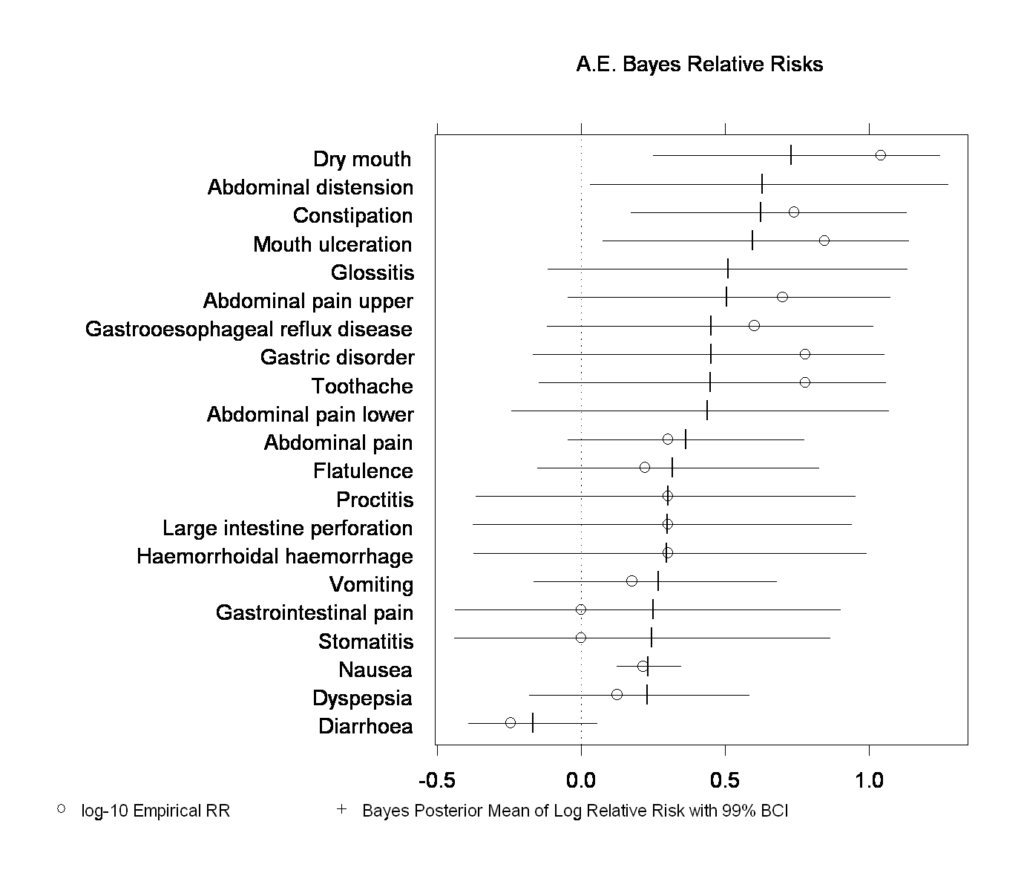
FlexBayes provides tools for modeling data using the Bayesian paradigm for statistical inference.
Bayesian modeling can create more realistic models, provide a natural way to address missing data and take advantage of prior information when doing analysis.
Create better clinical trial designs. Improve portfolio management and enhance many other applications. Additionally, the library includes built in examples of Bayesian response-adaptive clinical trial design, safety data analysis and hierarchical generalized linear models.
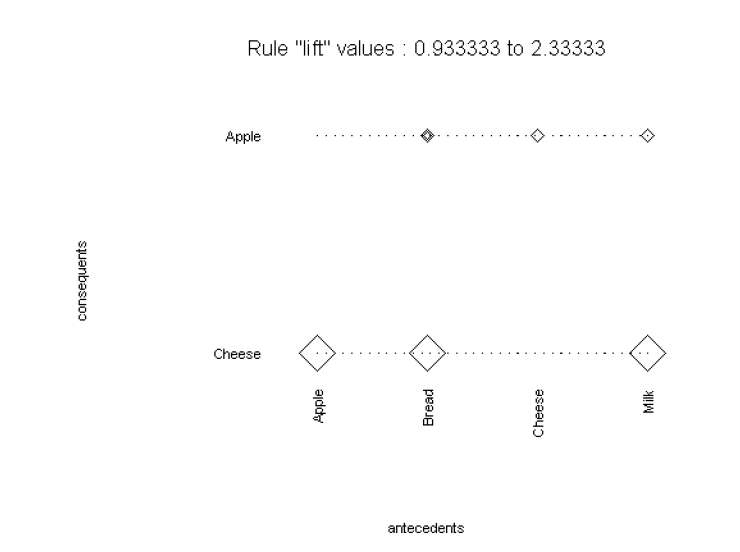
S+ Software includes Association Rules, which help uncover relationships between variables in large data sets.
Detect purchase patterns with Market Basket Analysis or analyse web site usage.
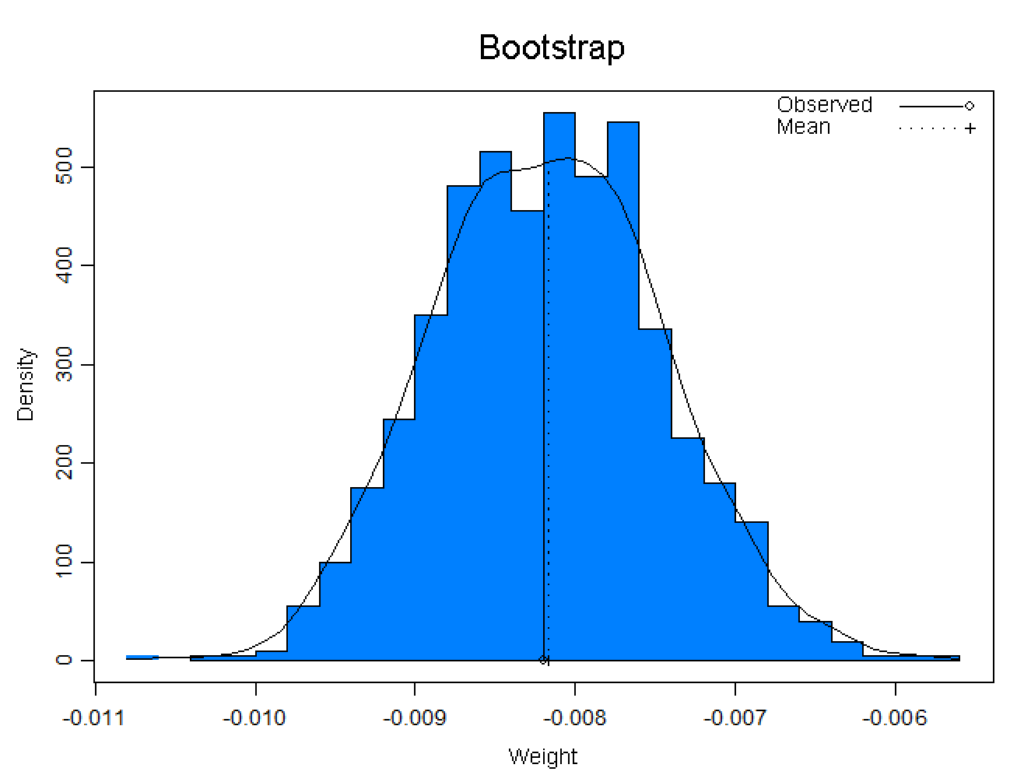
S+Resample library offers a variety of resampling techniques, such as bootstrap and permutation tests, which enable the use of standard statistics on smaller data sets. Offers graphical and numerical diagnostics for standard statistical assumptions.
Additionally, bootstrap tilting is included, which provides very accurate intervals and requires fewer samples than other methods.
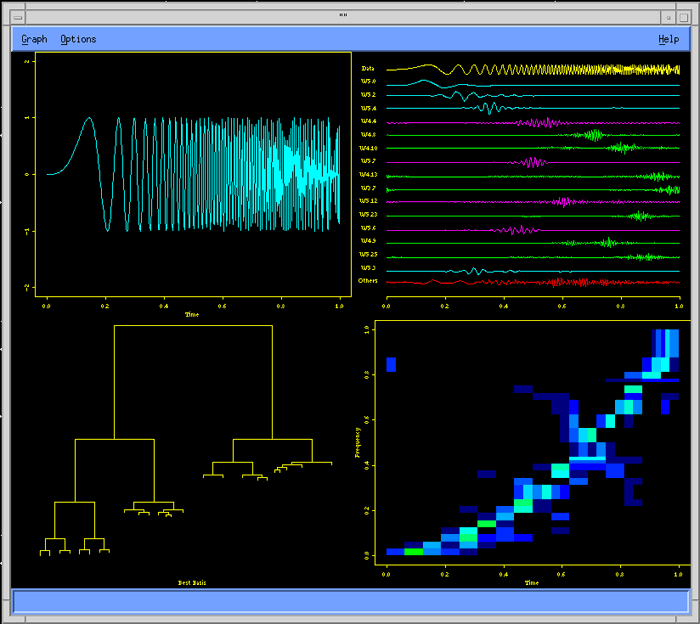
Wavelets library provides advanced signal and image analysis, time series analysis, statistical signal estimation and data compression analysis.
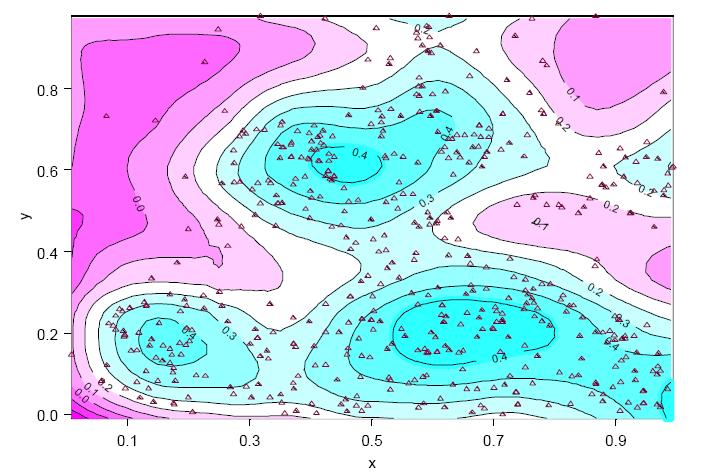
SpatialStats enables the exploration and modeling of spatially correlated data, which is useful in many areas such as environmental sciences, mining and petroleum engineering, natural resources management, geography, epidemiology, and demographics.
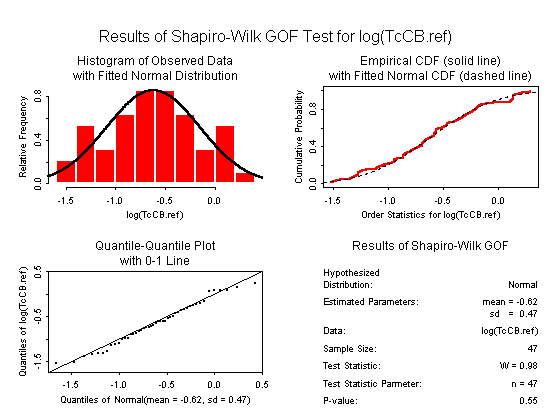
EnvironmentalStats provides a set of powerful functions for performing graphical and statistical analyses of environmental data.
Useful for anyone who has to make sense of environmental data, including hydrologists, soil scientists, atmospheric scientists, geochemists, environmental engineers, hazardous and solid waste site managers, regulatory agency analysts and enforcement officers.
Feature List
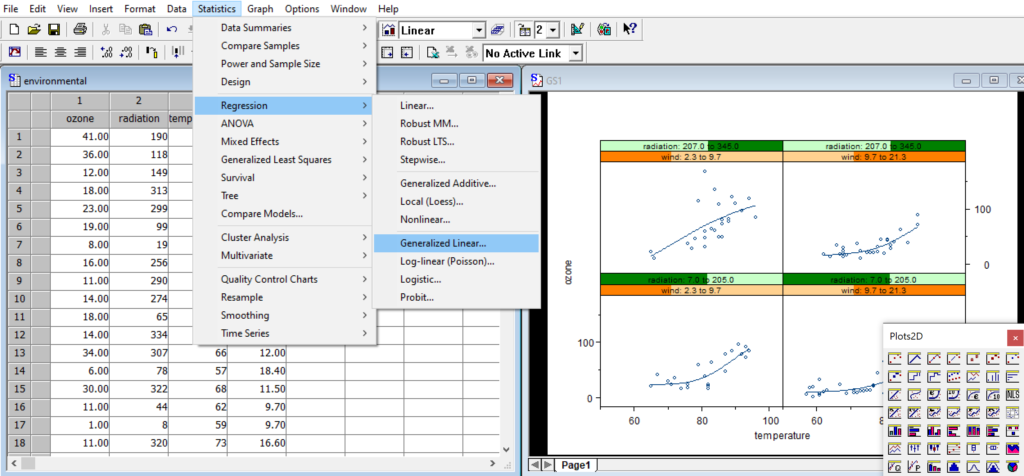
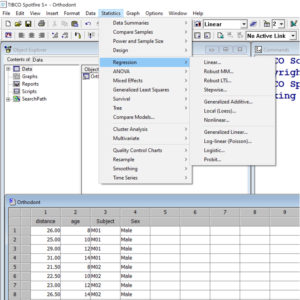
Convenient window-based GUI with easy-to-use menus and dialogs
File import and export dialogs
Database import and export dialogs¹
Dialogs for data preparation, charting and statistical modeling
Interactive command-line with history recall
Manage objects with Object Explorer¹
Script file editor¹
Multiple data and graphics windows
Cut-and-paste to Word, PowerPoint and Excel¹
Integrated Excel spreadsheets¹
PowerPoint Wizard: quickly create slides from charts¹
Create custom toolbars, menus and dialogs¹
On-line help and manuals
Integrate with many data and graphics formats
ASCII: fixed format, comma-separated, and tab-delimited
Spreadsheets: Excel, Lotus 1-2-3, Quattro Pro
Application data: SAS 7/8/9, SPSS, Matlab, Minitab, Sigma Plot, Systat, STATA, Gauss, Epi Info and more
Database files: Paradox, dBase, Access, FoxPro
Financial data sources: LIM, Bloomberg, FAME
Native database clients: SQL Server¹, Oracle, Sybase, IBM DB2
ODBC interface to compliant databases
Read and write Spotfire binary and text files directly, helping to preserve important metadata when moving between applications.
Export graphics as PDF, PostScript, GIF, PNG, JPG, WMF, bitmap, TIFF and more
Customised, automated reports: XML reporting library speeds development of customized reports incorporating statistical tables and publication-quality graphics.
Create custom graphics
Interactive graphics system with a large & normalized palette for the creation of statistical charts to your exact specifications.
Scatterplots, histograms, pie charts, box plots, bar charts, dot charts, time series charts, 3-D wireframe charts, image plots and many more.
Brush and spin dynamic visualization
Programmatic control over colors, lines, axes, annotations and layout
Unique Trellis™ graphics – create multiple charts conditioned by levels of one or more variables
Create interactive, embedded web-based charts with S‑PLUS Graphlets™
Element-Specific Graph arguments for plots and command-line graphics
Cox proportional hazards models with mixed effects
Left, right, and interval censoring
Time-dependent covariates and strata
Multiple event models
Competing risk models
Frailty models
Parametric survival
Expected survival
Person years analysis
Aalen’s Additive Regression Model
Time Series Analysis
Autocovariance, autocorrelation and partial autocorrelation
Smoothed periodograms
Box-Jenkins ARIMA models
Classical and robust AR
Long-memory models
Seasonal decompositions
Fourier transformations
Classical and robust smoothers and filters
Robust Statistics
Robust estimation and inferences
Robust MM regression
Robust GLM, ANOVA, covariance, principal components, and discriminant analysis
Least trimmed squares regression
Minimum absolute residual regression
Visually compare robust and traditional methods
Missing Data
Multiple imputation
Gaussian, logistic, and conditional Gaussian models
Date, Time, and Calendar Data
Univariate and multivariate time series
Aggregation, alignment, merging, and interpolation
Times and dates from milliseconds to millennia
Time zones with international daylight savings rules
Holidays and financial market closures
Custom time and date formats
Relative time, time sequence, and event objects
Powerful time-series charting
Mathematical Computations
Vector and matrix algebra
Matrix decompositions
Systems of linear equations
Locate roots
Nonlinear optimization
Constrained optimization
Ordinary differential equations
Numerical integration
APIs and system interfaces
APIs for C, C++, Java and Fortran
Language support for pipes, sockets, and files
DDE, COM and OLE interfaces¹
XML import and export
Reporting in XML, PDF, HTML and RTF
Support for 64-bit platforms
S+ 8.2 is focused on helping customers scale their analyses to solve larger analytic problems
Perform large analyses entirely in memory
64-bit support also improves the performance of very large analyses (S+ Big Data Library) by enabling larger chunks of data to be handled in each pass through the data
Matrix operations which underlie many common statistical methods are much faster in S+ 8.2 than in previous versions—up to 40x faster
Hexagonal binning plots to explore structure of large data sets
Data types for out-of-memory vectors, data frames, and time series
Award-winning S programming language
Specifically for exploratory data analysis and statistical modeling
Object-oriented, interpreted 4GL language
Interactive exploration and fast prototyping
Rich data structures: vector, matrix, array, data frame, list and many more
User-defined functions, objects, classes, methods and libraries
Library of over 4000 functions for data manipulation, graphics, statistical modeling, and integration
Hmisc and Design libraries for biostatistical and epidemiologic modeling (Harrell)
System Requirements
Processor
2GHz or faster, Quad core (1 GHz, Dual core, minimum)
Hard Disk
500 MB of disk space to install (If you are not installing on Drive C:\, an additional 50MB free disk space on Drive C:\ is required for the installation) Administrator rights are required to install
Operating System
Microsoft® Windows 10 Microsoft® Windows 7 (32-bit and 64-bit) Microsoft® Windows Vista® SP2 (32-bit & 64-bit) Microsoft® Windows XP® SP3 (32-bit) Parallels Desktop 15 for MacOS X 10.10 – 10.15


 Getting Started with S+ Course$1,500.00 excludes Tax