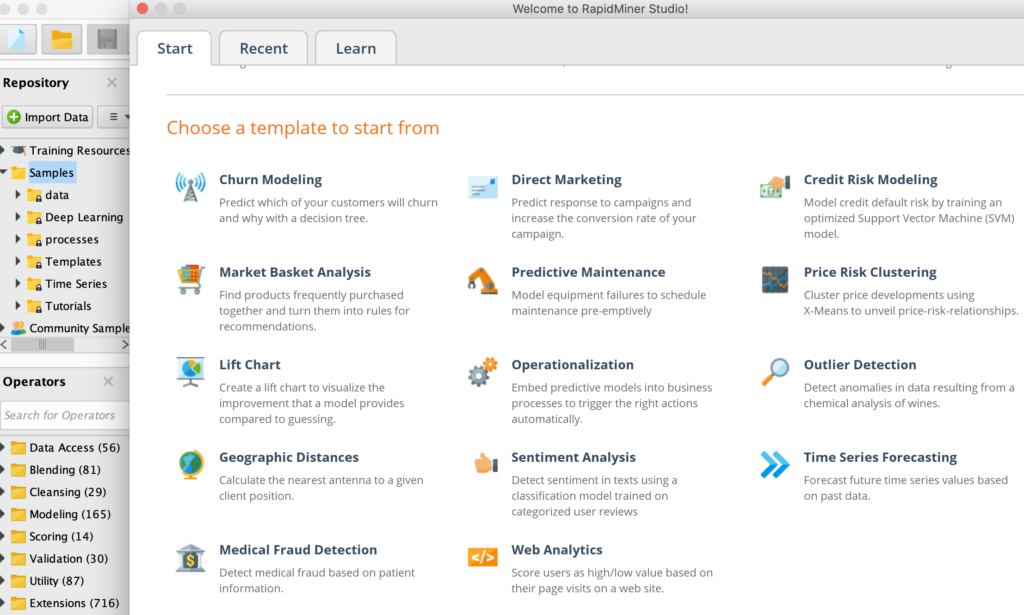
In a few clicks, build validated machine learning models, for customer churn prediction, predictive maintenance, credit risk modelling, sentiment analysis etc. Combine R or Python code seamlessly.
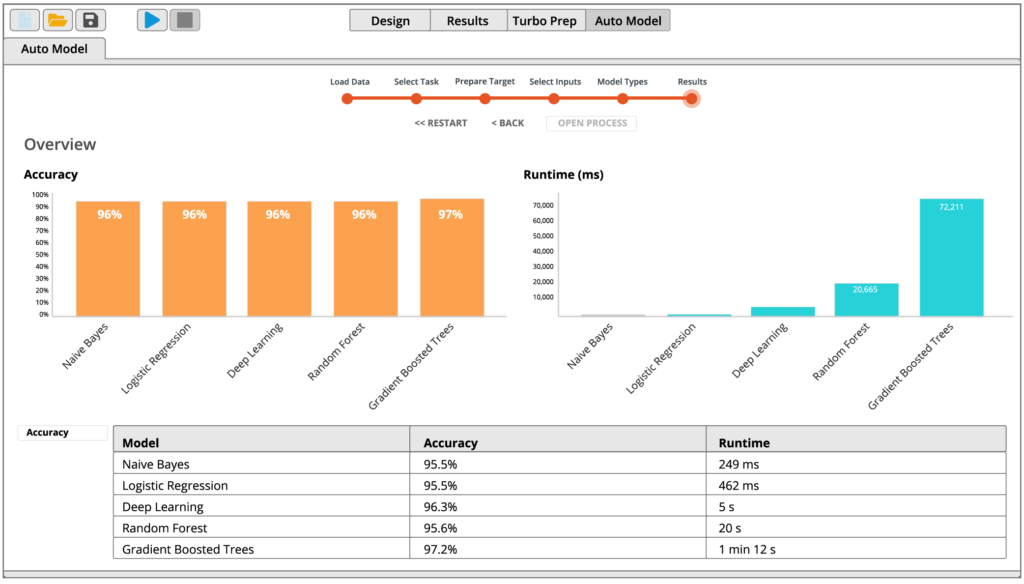
RapidMiner Auto Model builds validated models in 5 clicks, with automated machine learning.
Pre-built templatesfor common use cases including customer churn, predictive maintenance, fraud detection, and many more.
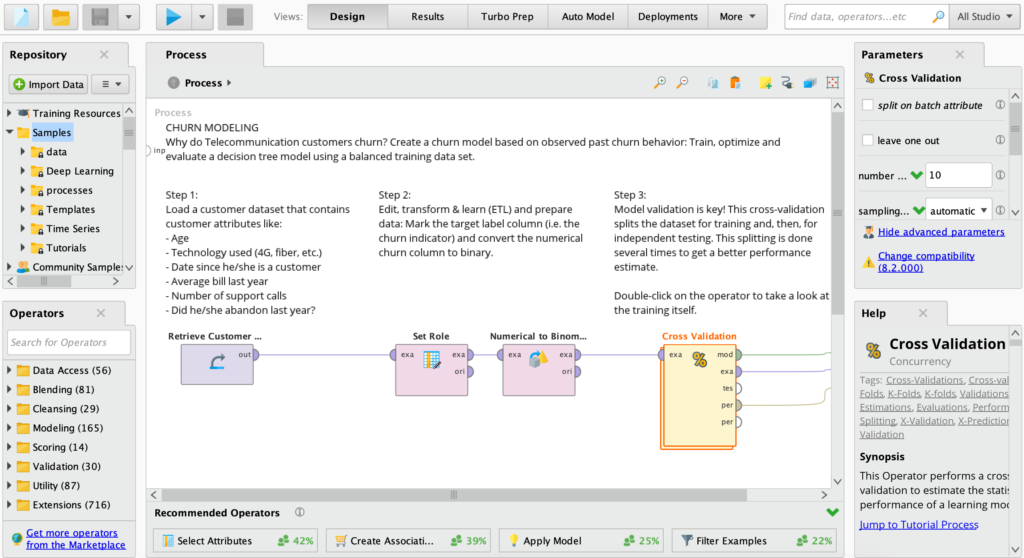
Visual Workflow Designer
Increase productivity across the entire data science team, from analysts to experts.
Accelerate and automate the creation of predictive models in a drag and drop visual interface.
Rich library of 1500+ algorithms and functions ensures the best model for any use case.
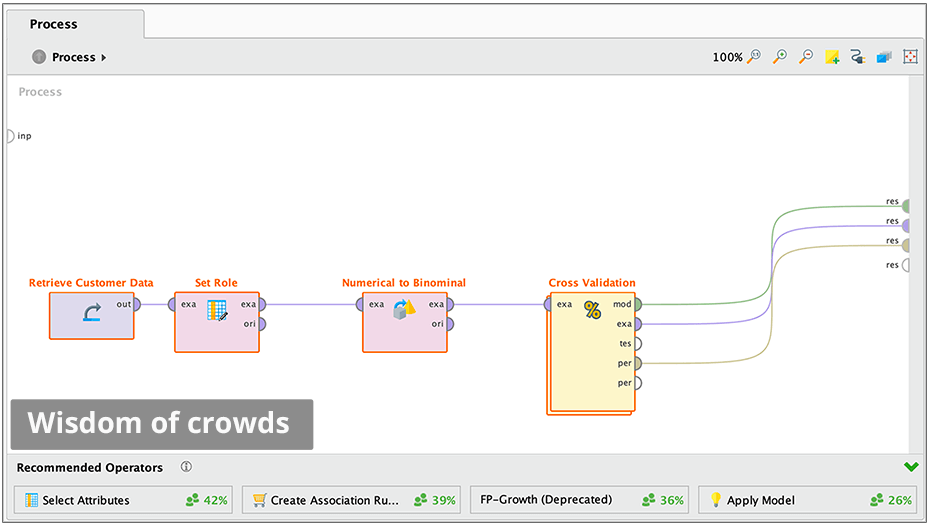
“Wisdom of Crowds” provides proactive recommendations at every step to help beginners.
Connect to any data source
Work with all of your data, no matter where it lives.
Create point and click connections to databases, enterprise data warehouses, data lakes, cloud storages, business applications and social media.
Easily re-use connections any time and easily share them with anyone who needs access.
Connect to new sources, including social media, with extensions from the RapidMiner Marketplace
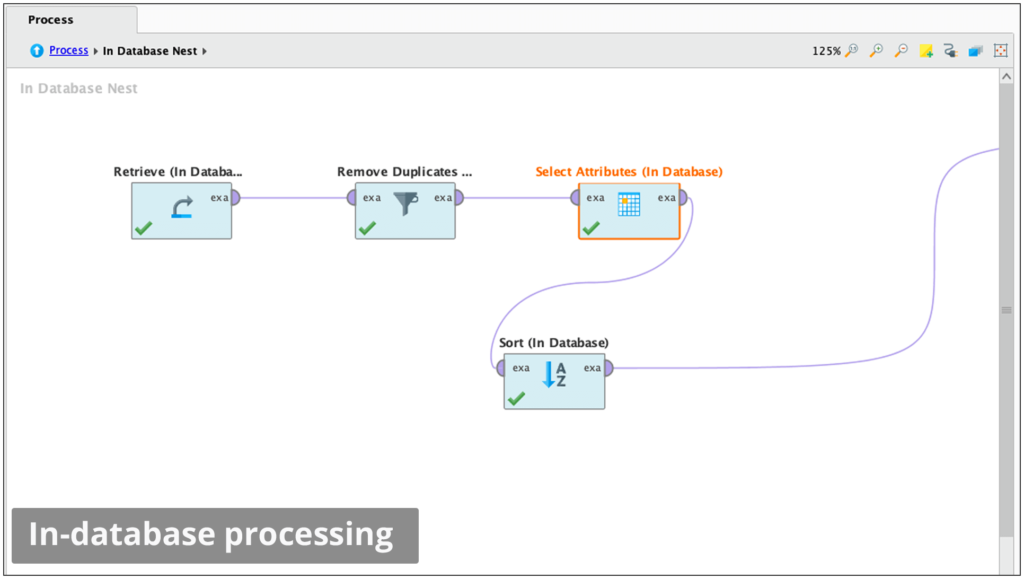
Automated In-database Processing
Run data prep and ETL inside databases to keep your data optimized for advanced analytics.
Query and retrieve data without writing complex SQL.
Harness the power of highly scalable database clusters.
Supports MySQL, PostgreSQL, and Google BigQuery.
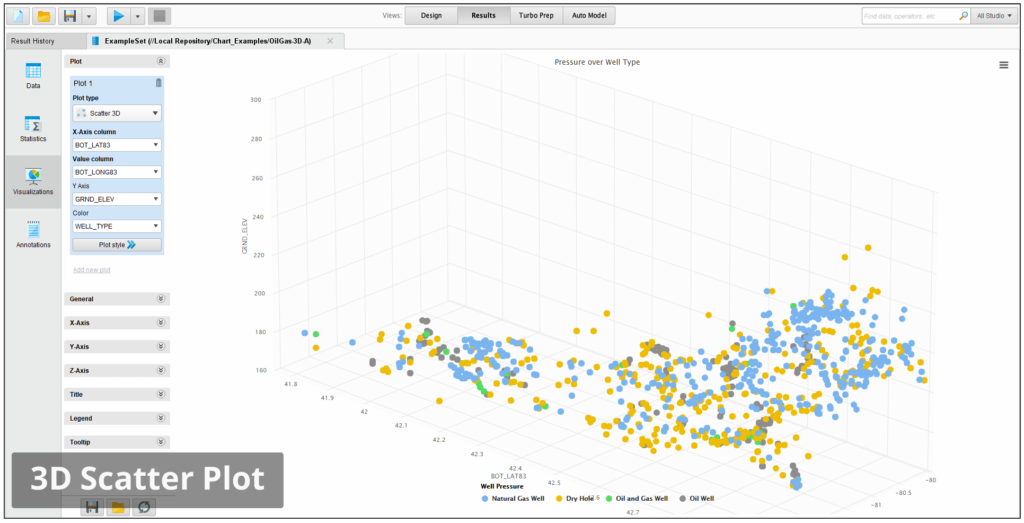
Data Visualisation
Understand patterns, trends, and distributions with scatter plots, histograms, line charts, parallel coordinates, box plots, and more.
Explore data using robust statistical overviews and over 30 interactive visualizations.
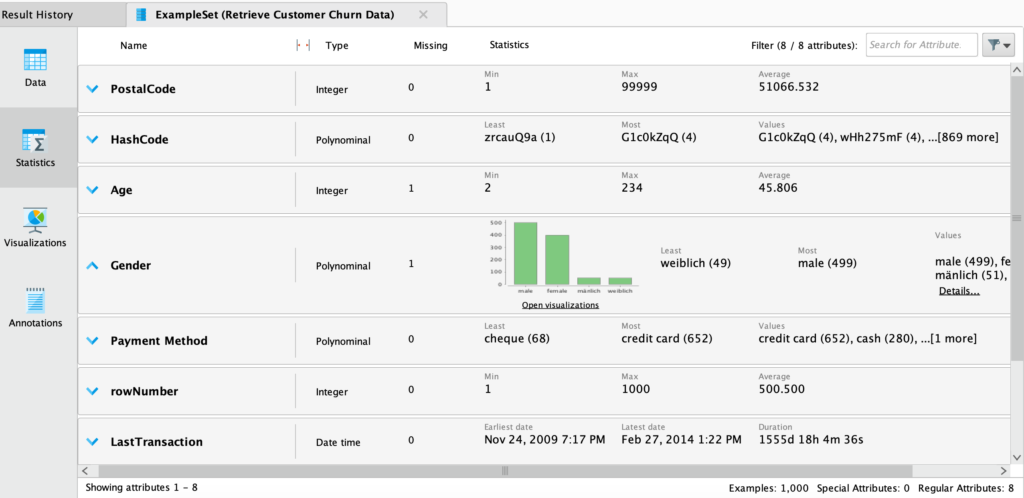
Data profiling and exploration with the Statistics view
Summary stats of categorical, numeric and time-date data, displayed.
Quickly identify and fix common data quality problems including missing values and outliers.
Data Prep and Blending
Eliminate the hassle of preparing data for predictive modeling.
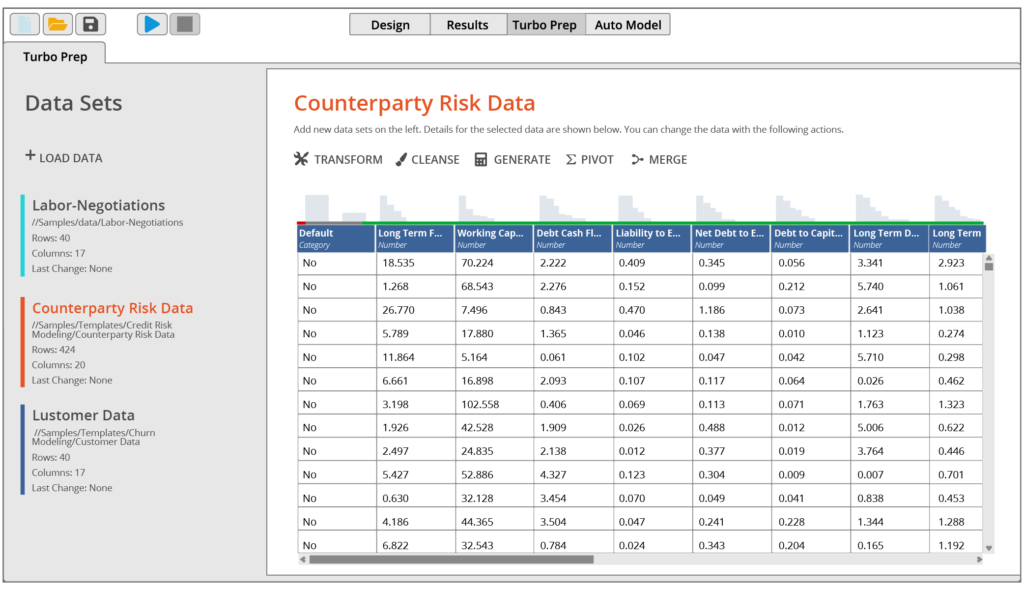
RapidMiner Turbo Prep offers a fully interactive point and click data prep experience.
Extract, join, filter, and group data across any number of sources.
Create repeatable data prep and ETL processes that can be scheduled and shared.
Machine Learning
Quickly create impactful machine learning models, without writing code. Choose from hundreds of supervised and unsupervised machine learning algorithms
Implement basic and advanced ML techniques including regression, clustering, time-series, text analytics, and deep learning.
Build the model to be sensitive to constraints like costs to optimize the predictions for your desired business impact. Use both automated and manual feature engineering to optimize model accuracy
RapidMiner Studio Model Validation operators – just select the machine learning model.
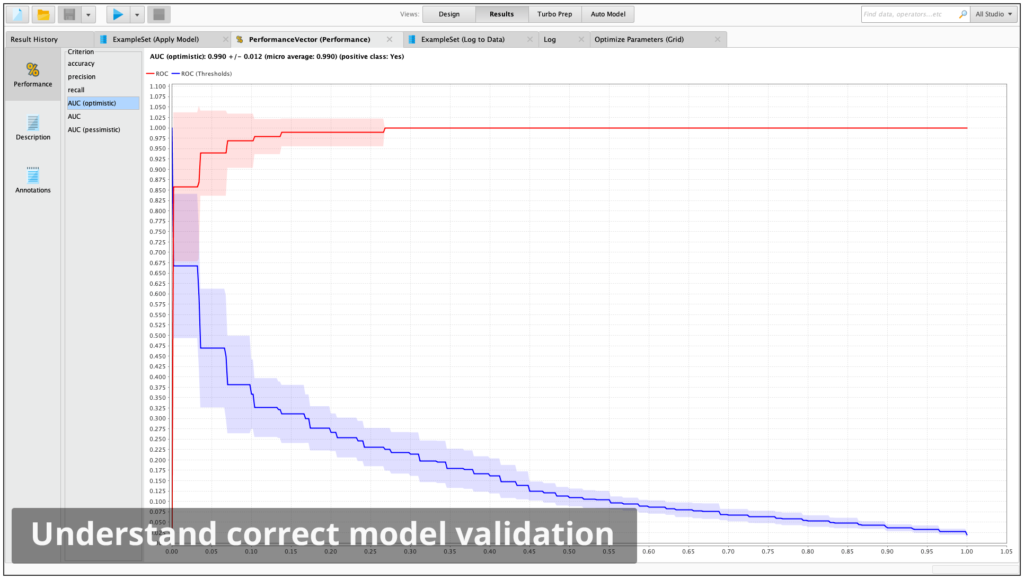
Understand the true performance of a model before deploying to production.
Eliminate overfitting through a unique approach that prevents model training pre-processing data from leaking into the application of the model.
Add proven techniques, like cross validation, to a model with just a single mouse click.
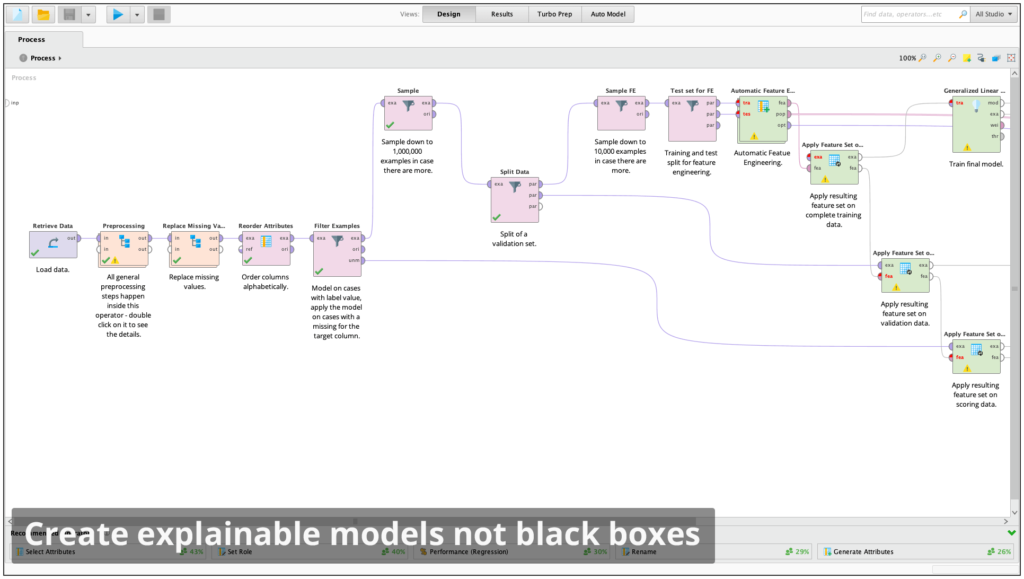
Explainable Models Not Black Boxes
Create visual data science workflows that are easy to explain and easy to understand. Each step in the data prep, modeling, and validation process is documented for complete transparency.
Visuals are easy to explain to others in the organization to gain buy-in for deployment.
Supports the Local Interpretable Model-Agnostic Explanations (LIME) framework.
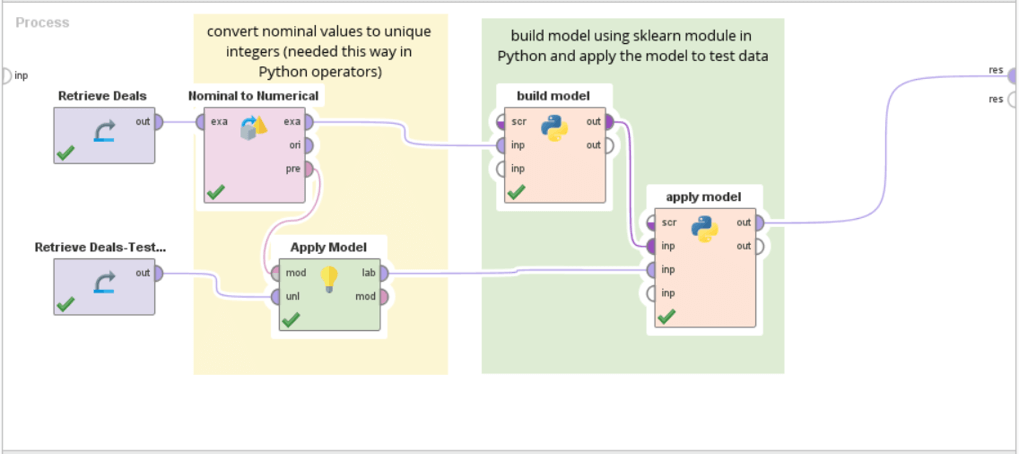
Scalable code deployment and collaboration between coders and non-coders. Deploy code-based models and code-containing models into a scalable platform.
Eliminate duplicate work and ensure others re-use your work by uploading your code snippets into the RapidMiner repository for use in a simplified visual workflow designer
Make use of the vibrant Python ecosystem by building on top of specialized and cutting-edge libraries and making it available for the rest of your team using RapidMiner.
Leverage data prep and ETL pipelines others have produced.
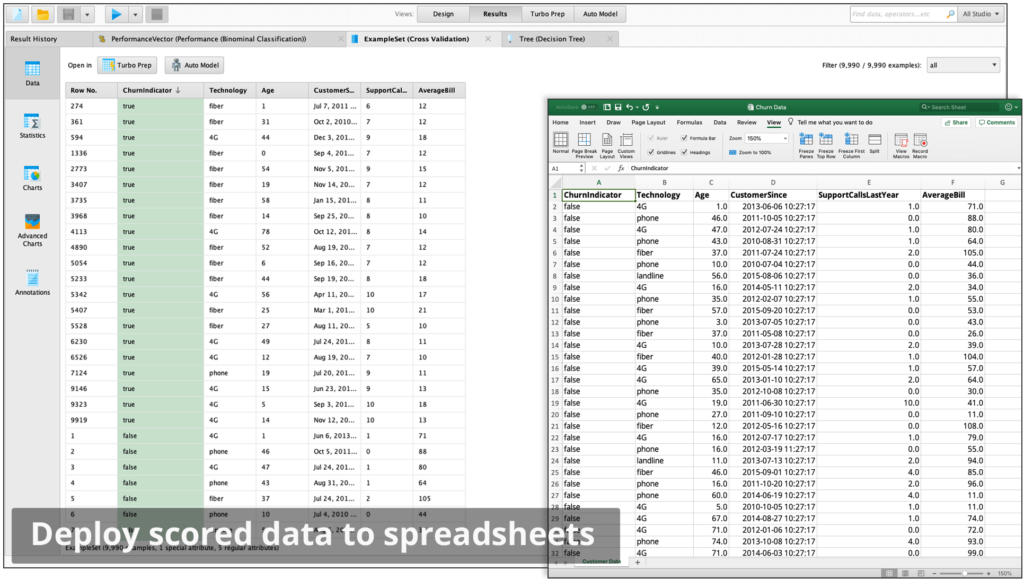
Flexible Scoring
Turn predictive insights into business impact. Quickly deploy scored data to spreadsheets and data visualization tools or turn models into production web services with RapidMiner AI Hub.
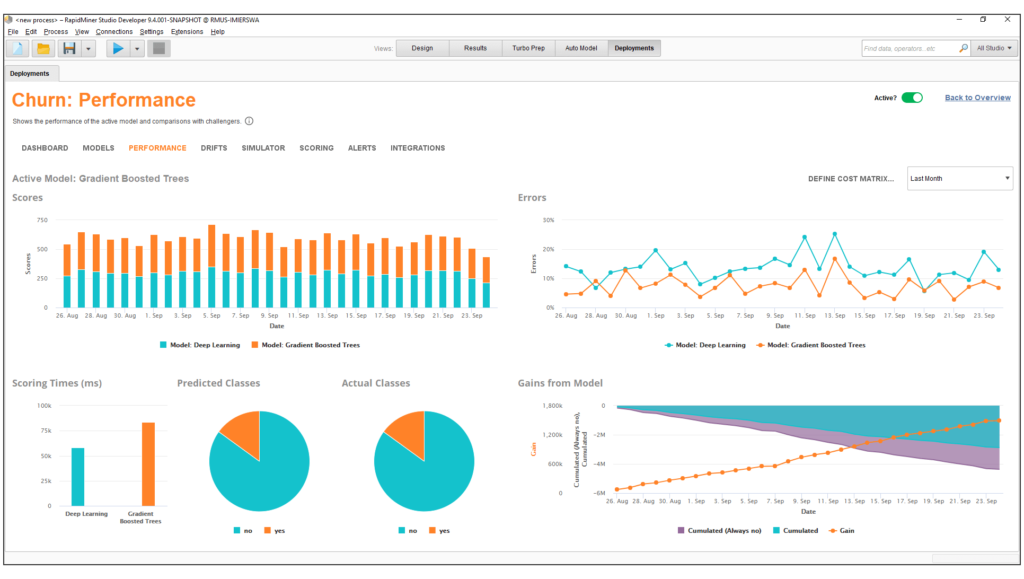
RapidMiner Model Ops delivers an easy way for less advanced users to put models into production and properly manage them
RapidMiner for Teams
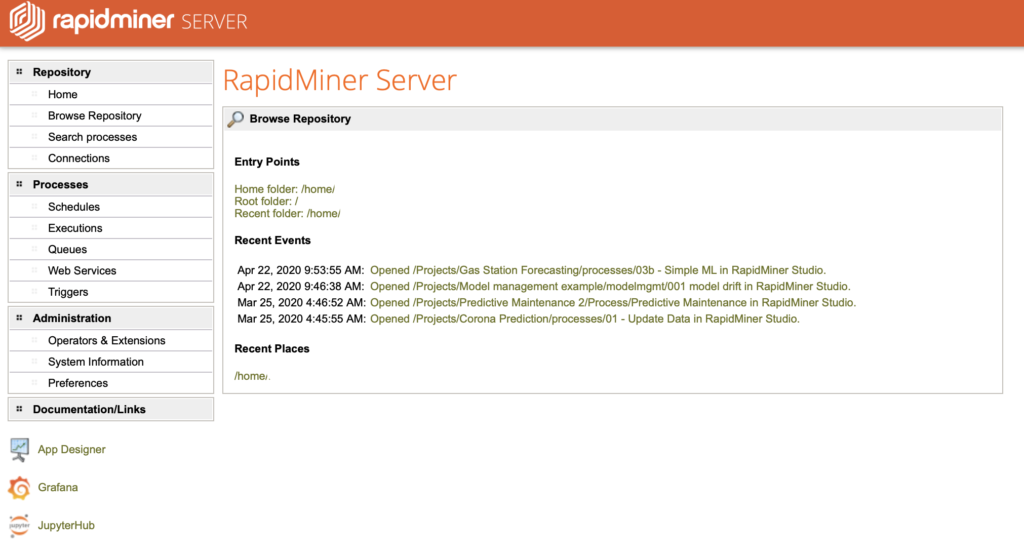
RapidMiner AI Hub – Team collaboration, process automation, accelerate model creation, scale and deploy
RapidMiner Go – Automated and guided machine learning web interface. Point/click data science for domain experts, business users and analysts.
Request pricing or a 30 minute demo
Let’s create a plan for your specific needs!
Feature List
Data Access & Management
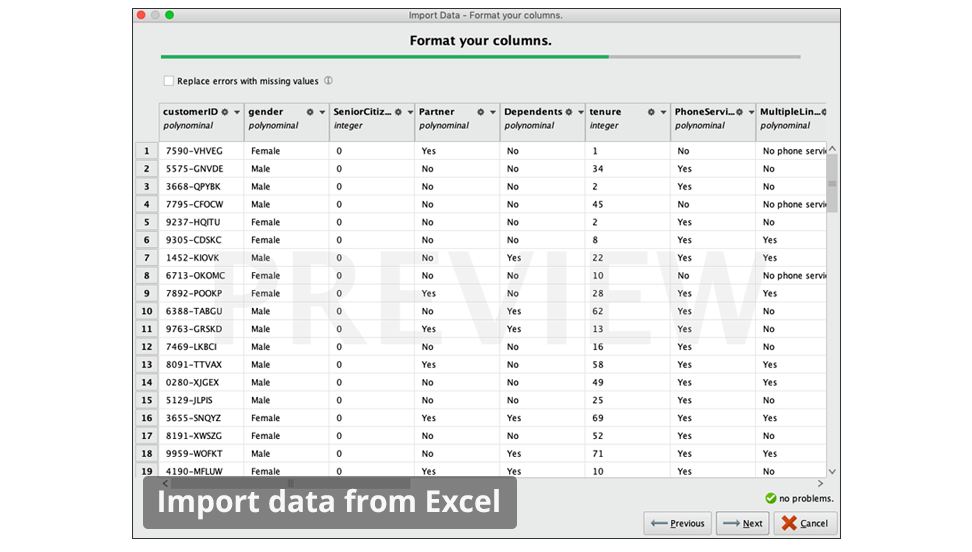
Access, load and analyze any type of data – both traditional structured data and unstructured data like text, images, and media. Also transform unstructured data into structured.
Access to more than 40 file types including SAS, ARFF, Stata, and via URL
Wizards for Microsoft Excel & Access, CSV, and database connections
Access to NoSQL databases MongoDB and Cassandra
Write to Qlik QVX or Tableau TDE files
Access to Cloud storage like Dropbox and Amazon S3
Access to text documents and web pages, PDF, HTML, and XML
Support for all JDBC database connections including Oracle, IBM DB2, Microsoft SQL Server, MySQL, Postgres, Teradata, Ingres, VectorWise, and more
Access to full-text index & search platform SOLR
Access to Twitter & Salesforce.com
Repository-based data management on local systems or central servers via RapidMiner Server
Connect to Zapier and trigger Zapier tasks
Access to time series data, audio files, images, and many more
Enhanced data and metadata editor for repository entries
Data Exploration:
Descriptive Statistics
Univariate statistics: mean, median, minimum, maximum, standard deviation, and number of missing values and plots
Nominal / categorical attributes: number of categories, counts, mode, number of missing values
Date attributes: minimum, maximum, number of missing values
Distribution plots
Bivariate statistics and plots: Covariance matrix
Correlation matrix
Anova matrix
Grouped Anova
Transition matrix
Transition graph
Mutual information matrix
Rainflow matrix
Scaled and non-scaled mean-deviation plots
Plots of attribute weights based on multiple types of connection with targets
Simple rescaling of axis
Plots can be easily copied and pasted into other applications or exported as in PNG, SVG, JPEG, EPS or PDF formats
Choose from a variety of different colour schemes
Graphs and Information
Easy-to-configure charts for fast insight generation from various visualizationsScatter, scatter matrices
Line
Bubble
Parallel
Deviation
Box
3-D
Density
Histograms
Area
Bar charts, stacked bars
Pie charts
Survey plots
Self-organizing maps
Andrews curves
Quartile
Surface / contour plots, time series plots
Pareto / lift chart
Support for zooming and panning
Additional advanced chart engine for arbitrary definition of multiple charts including: on-the-fly grouping, filtering & aggregation
Data Prep Basics
Select attributes operator
Aggregations for multiple groups and functions like sum, average, median, standard deviation, variance, count, least, mode, minimum, maximum, product, or log product
Set operators like join, merge, append, union, or intersect
Operators for handling meta data like rename or attribute role definition
Filtering rows / examples according to range, missing values, wrong or correct predictions, or specific attribute value
Filtering outliers according to distances, densities, local outlier factors, class outlier factors, local correlation integrals, or clustering based outlier detections
Identification and removal of duplicates
Sampling
Absolute, relative, or probability–based
Balanced
Stratified
Bootstrapping
Model-based
Kennard-Stone
Range
Transformations
Normalization and standardization
Z-transformation, range transformation, proportion transformation, or interquartile ranges
Preprocessing models for applying the same transformations on test / scoring data
De-normalization making use of preprocessing models
Scaling by weights
All kinds of type conversions between numerical attributes, nominal / categorical attributes, and date attributes
Operator for guessing correct meta data from existing data sets
Adjustment of calendar dates and times
Sorting and Pareto sort
Shuffling
Rotations of data sets: Pivoting, De-Pivoting, and transposing data sets
Expression builder for arbitrary transformations on attributes: Statistical functions: round, floor, ceiling, average, minimum, maximum
Basic functions: addition, subtraction, multiplication, division, less than, greater than, less or equal, greater or equal, equal, not equal, Boolean not, Boolean and, Boolean or
Log and exponential functions: natural logarithm, logarithm base 10, logarithm dualis, exponential, power
Text functions: to string, to number, cut, concatenation, replace and replace all, lower, upper, index, length, character at, compare, contains, equals, starts with, ends with, matches, suffix, prefix, trim, escape HTML
Date functions: parse, parse with locale, arse custom, before, after, to string, to string with locale, to string with custom pattern, create current, difference, add, set, and get
Ensure high model quality through hold-out data sets
Create training, validation, and test data sets
Default stratification by the class if available
User-defined partitions possible
Resulting in example sets usable for modeling or further transformations
Binning
Interactive binning by user specification
Simple binning
Count-based
Size-based
Frequency-based
Entropy-based minimizing the entropy in the induced partitions
Handling of missing values as its own group
Weighting and Selection
Attribute weighting
– 30+ weighting schemes measuring the influence of attributes & forming base or weight-based selections (filter approach)
Attribute selection
– Selection of attributes by user specification
– Removal of “useless” attributes
– Removal of attributes unrelated to target based on a chi-square or correlation-based selection criterion
– Removal of attributes unrelated to target based on arbitrary weighting schemes like information gain, Gini index, and others
– Removal attributes with missing values
– Selection of random attribute subsets
Attribute space transformations
– Principal Component Analysis (PCA)
– Singular Value Decomposition
Support for Fast Map
Plots for principal components coefficients, Eigenvalues, and cumulative variance of Eigenvalues
Calculates Eigenvalues and Eigenvectors from correlation and covariance matrices
Choose the number of components to be retained
Independent component analysis (ICA)
Generalized Hebbian Algorithm (GHA)
Dimensionality reduction with Self- Organizing Maps (SOM)
Correspondence Analysis
Attribute Generation
Operators for generating IDs, copies, concatnations, aggregations, products, Gaussian distributions, and more
Automatically optimized generations and detection of latent variables: Evolutionary weighting
Forward weighting
Backward weighting
Multiple algorithms for the automatic creation of new attributes based on arbitrary functions of existing attributes
Genetic programming
Similarity Calculation
Calculation of similarities between data points
Cross Distances operator computes similarities between data points of two data sets
Numerical distance measures
Euclidean
Camberra
Chebychev
Correlation
Cosine
Dice
Dynamic Time Warping
Inner product
Jaccard
Kernel-Euclidean
Manhattan
Max-Product
Overlap
Nominal / categorical distance measures
Nominal
Dice
Jaccard
Kulczynski
Rogers-Tanimoto
Russel-Rao
Simple Matching
Mixed Euclidean distance for cases with numerical & nominal attributes
Bregman divergences
Itakura-Saito
Kullback-Leibler
Logarithmic loss
Logistic loss
Mahalonobis
Squared Euclidean
Squared Loss
Clustering
User defined clustering or automatically chooses the best clusters
Support Vector Clustering
Several strategies for encoding class into the clustering
k-Means (for all available distance and similarity measures)
k-Medoids (for all available distance and similarity measures)
Kernel k-Means
X-Means
Cobweb
Clope
DBScan
Expectation Maximization Clustering
Self-organizing maps
Agglomerative Clustering
Top Down Clustering
Operators for flattening hierarchical cluster models
Extraction of prototypes for centroid-based cluster models
Market Basket Analysis
Associations and sequence discovery
Measuring quality of rules by support, confidence, La Place, gain, ps-value, lift or conviction
Interactive filter for frequent item sets
Interactive visualization of association rules as a network graph
Rules description table
User defined rule filtering depending on minimum value for the above criteria or matching criteria for specific items
Faster than ever FP-Growth operator (similar to Apriori but far more efficient)
Generalized sequential patterns
Modular operators for the creation of frequent item sets or association rules only
Post-processing to unify of item sets
Application of association rules to deploy as a recommendation engine
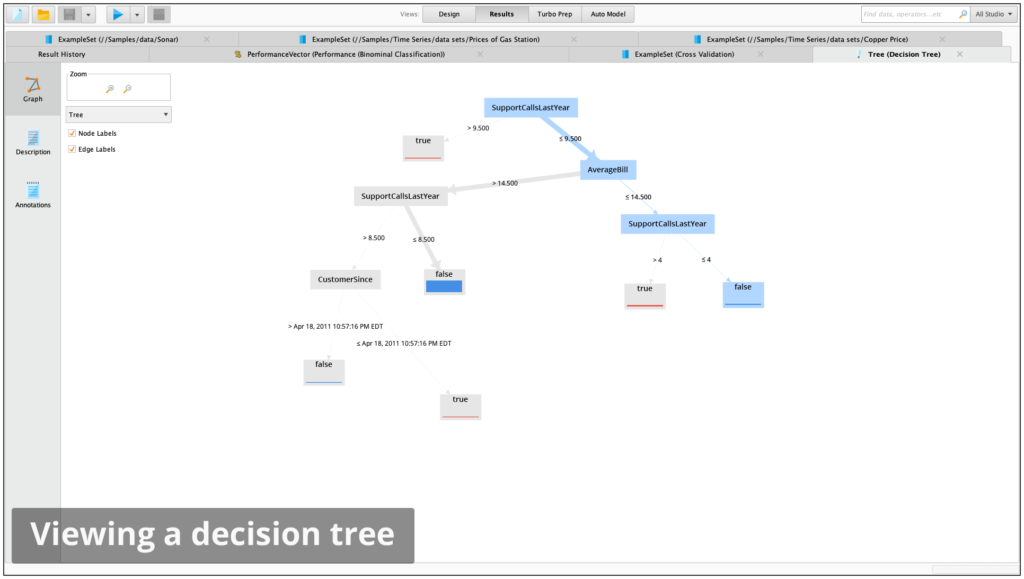
Decision Trees
Easy-to-understand models
Supported methods: classification and regression trees (CART), CHAID, decision stumps, ID3, C4.5, Random Forest, bagging and boosting
Support for multi-way trees
Gradient Boosted Trees (GBT)
Pre-pruning and pruning
Split criteria include information gain, gain ratio, accuracy, and Gini index
Error-based and confidence-based pruning
Distribution shown at tree leaves
Height of distribution bars correlate to number of examples in each leaf
Majority class shown at tree leaves
Class counts shown as tool tip at tree leaves
The darkness of connections correlates with the number of examples on this path
Graphical and textual representation of trees
Interactive visualization of trees including selecting and moving of nodes
Rule Induction
Recursive technique with easy-to-read results
Especially useful for modeling rare events like for subgroup discovery
Supported methods: rule induction, single rule induction, single attribute, subgroup discovery, tree to rules
Supported splitting criteria include information gain and accuracy
Definition of pureness of rules
Error-based pruning
Easy to read and parse representation of rule sets as textual descriptions or tables
Bayesian Modeling
Naïve Bayes
Kernel Naïve Bayes
Bayes models can be updated and are therefore especially suitable for large data sets or online stream mining
Regression
Linear
Logistic
Generalized Linear Model (H2O)
Kernel Logistic Regression
Linear Discriminant Analysis (LDA)
Quadratic Discriminant Analysis (QDA)
Regularized Discriminant Analysis (RDA)
Stepwise forward and backward selection
Selection with M5’, t-test or iterative t-test
Seemingly unrelated regression
Vector linear regression
Polynomial regression
Local polynomial regression
Gaussian Processes
Neural networks
Flexible network architectures with different activation functions
Multiple layers with different numbers of nodes
Different training techniques
Perceptron
Multilayer Perceptron
Deep Learning (H2O)
Automatic optimization of both learning rate and size adjustment of neural networks during training
Support Vector Machines
Powerful and robust modeling techniques for large numbers of dimensions
Offers overfitting control by regularization
Especially suitable for modeling unstructured information like text data
More than 10 different methods for support vector classification, regression, and clustering
Support Vector Machine
Relevance vector machine
Linear, Evolutionary, PSO, Fast Large Margin, Hyper Hyper
Kernel functions include dot, radial basis function, polynomial, neural, Anova, Epachnenikov, Gaussian combination, or multiquadric
Simple support vector machines for boosting support
Linear-time support vector machine for fast training also for large numbers of dimensions and examples
Memory-Based Reasoning
k-Nearest Neighbors for classification and regression
Locally weighted learning
Optimized scoring through ball trees data search structure
Model Ensembles
Hierarchical models
Combination of multiple models to form a potentially stronger model
Vote
Additive regression
Ada boost
Bayesian boosting
Bagging
Stacking
Classification by regression
Meta cost for defining costs for different error types and detecting optimal models avoiding expensive errors
Model Validation
RapidMiner Studio follows a stringent modular approach which prevents information used in pre-processing steps leaking from model training into the application of the model. This unique approach is the only guarantee that no overfitting is introduced and no overestimation of prediction performances can occur
Performance criteria for numerical and nominal / categorical targets, including:
Accuracy
Classification error
Kappa
Area under curve (AUC)
Precision
Recall
Lift
Fallout
F-measure
False positives
False negatives
True positives
True negatives
Sensitivity
Specificity
Youden index
Positive predictive value
Negative predictive value
PSEP
Correlation
Spearman rho
Kendall tau
Squared correlation
Absolute error
Relative error
Normalized absolute error
Root mean squared error (RMSE)
Root relative squared error (RRSE)
Squared error
Cross entropy
Margin
Soft margin loss
Logistic loss
Calculating significance tests to determine if and which models performed better
T-test
Anova
Find threshold operator to determine optimal cutoff point for binominal classes
Performance estimation for cluster models based on distance calculations, density calculations, or item distributions
Embed pre-processing steps into the validation
Display multiple results in history to help better evaluate model performance
Various techniques for the estimation of model performance: Cross validation (with parallel execution of the folds)
Split validation
Bootstrapping
Batch cross validation
Wrapper cross validation
Wrapper split validation
Visual evaluation techniques
Lift chart
ROC curves
Confusion matrix
Scoring
Operator for applying models to datasets (Scoring)
Support of predictive models, cluster models, preprocessing models, transformation models, and models for missing value imputations
Storing of models in central repositories for reuse in other processes and projects
Applying a model creates optimal scores by ignoring unused attributes and handling previously unseen values
Import and export of RapidMiner models, R models, and Weka models from repository or files
Support of PMML 3.2 and 4.0
Background process execution
Utility-like process control operations that lets you build processes that behave like a program to repeat and loop over tasks, branch flows and call on system resources
Execute multiple processes in parallel
Long-running processes can be run in the background, while continuing to work on other process in the foreground for faster and more effective development iterations.
Processes running in the background can be monitored. Results and logs can be reviewed once they are available
The maximum number of allowed processes running simultaneously can be configured to adapt to the hardware resources and the demand of the processes being executed. The default is the number of cores minus one
Scripting
Write scripts for easy-to-complex data preparation and transformation tasks where existing operators might not be sufficient
Incorporate procedures from other processes or projects
Develop custom models
Augment scoring logic by custom post-processing or model application procedures
Easy-to-use program development interface: Predefined imports for common data structures
Syntactic sugar for simplified data access and alteration
Interactive code editor and syntax high-lighting
Execute command line programs and integrate results and result codes in processes
Execution of SQL statements directly in database
Seamless integration of the various programming languages into the RapidMiner Studio user interface: Execution of Groovy scripts within RapidMiner Studio processes
Execution of OS scripts within RapidMiner Studio processes
Execution of R scripts within RapidMiner Studio processes
Execution of Python scripts within RapidMiner Studio processes
Predefined scripted models & transformtions available as operators
Custom scripts can be stored and executed as own operators within a process
Process Control
Organize segments in sub-processes and reuse them in different projects
Repeat execution over a segment of a process
Support for loops
Loop (basic loop, with parallel execution of the iterations)
Attributes (parallel execution of the iterations)
Labels
Subsets
Values (parallel execution of the iterations)
Examples
Clusters
Batches
Data Sets
Data Fractions
Parameters
Files (parallel execution of the iterations)
Repository entries
Branches (if-then-else) based on:
Data values
Attribute existence
Numbers of examples
Performance values
Existence of files and process inputs
Definition of macros
Arbitrary expressions
Creation of collections of the same type
Collection handling: selection, flattening, or looping
Remembering and recalling (intermediate) process results for complex process designs
Handling expected and unexpected errors and exceptions
Automatic Optimization
Automatic selection of best performing sub processes
Measuring the influence of preprocessing steps by nested cross validations / other validations
Automatic selection of best model type and parameters
Automatic selection of best attribute subsets
Automatic optimization of process para-meters, including modeling parameters
Grid
Quadratic
Evolutionary
Macros
Centralized definition of macros / variables containing arbitrary textual or numerical content
Usage of macros everywhere in the process design, especially as value for parameters
Macros can be defined during the process or in the process context
Definition of macros in the context allows for parameterization of complete processes, e.g. for transforming processes into customizable web services
Extraction of macro values from data values, meta data or statistics supported
Expression engine for calculating arbitrary macro values from existing macros
Logging and Process-Based Reporting
Logging can be introduced at arbitrary places within a process
Logging can collect parameter values, performance values, or specific values for each operator, e.g. the current generation for evolutionary algorithms
Data values can be logged
Macro values can be logged
Logged values can be transformed into several formats including: data sets and weights which can be stored, transformed, analyzed, or visualized like any other data set.
In cases where logging alone is not sufficient, a complete process-based reporting engine allows for the collection of arbitrary results in static reports
Different formats like PDF, Excel, HTML, or RTF supported
Different reporting styles including a sequential report or portals
Support of sections with up to 5 levels
Arbitrary process results as well as intermediate results can be transformed into different types of visualizations like tables, charts etc.
Support for page breaks and other style information
Combination with loops or other process control structures allows for highly-detailed result overviews even for complex process designs
System Requirements
Processor
3GHz or faster, Quad core (2 GHz, Dual core, minimum)
RAM
16GB RAM (4GB RAM, minimum)
Hard disk space
>100GB free disk space (>1GB free disk space, minimum)
Display
(1280×1024 pixel resolution, minimum)
Operating System
Windows 10 (64-bit highly recommended) Windows 8.1 Windows 8 Windows 7 Linux (64-bit only) MacOS X 10.10 – 10.15